$UAI
1. Basic Market Information
· Trading pair: UAI/USDT perpetual contract (UnifAI Network).
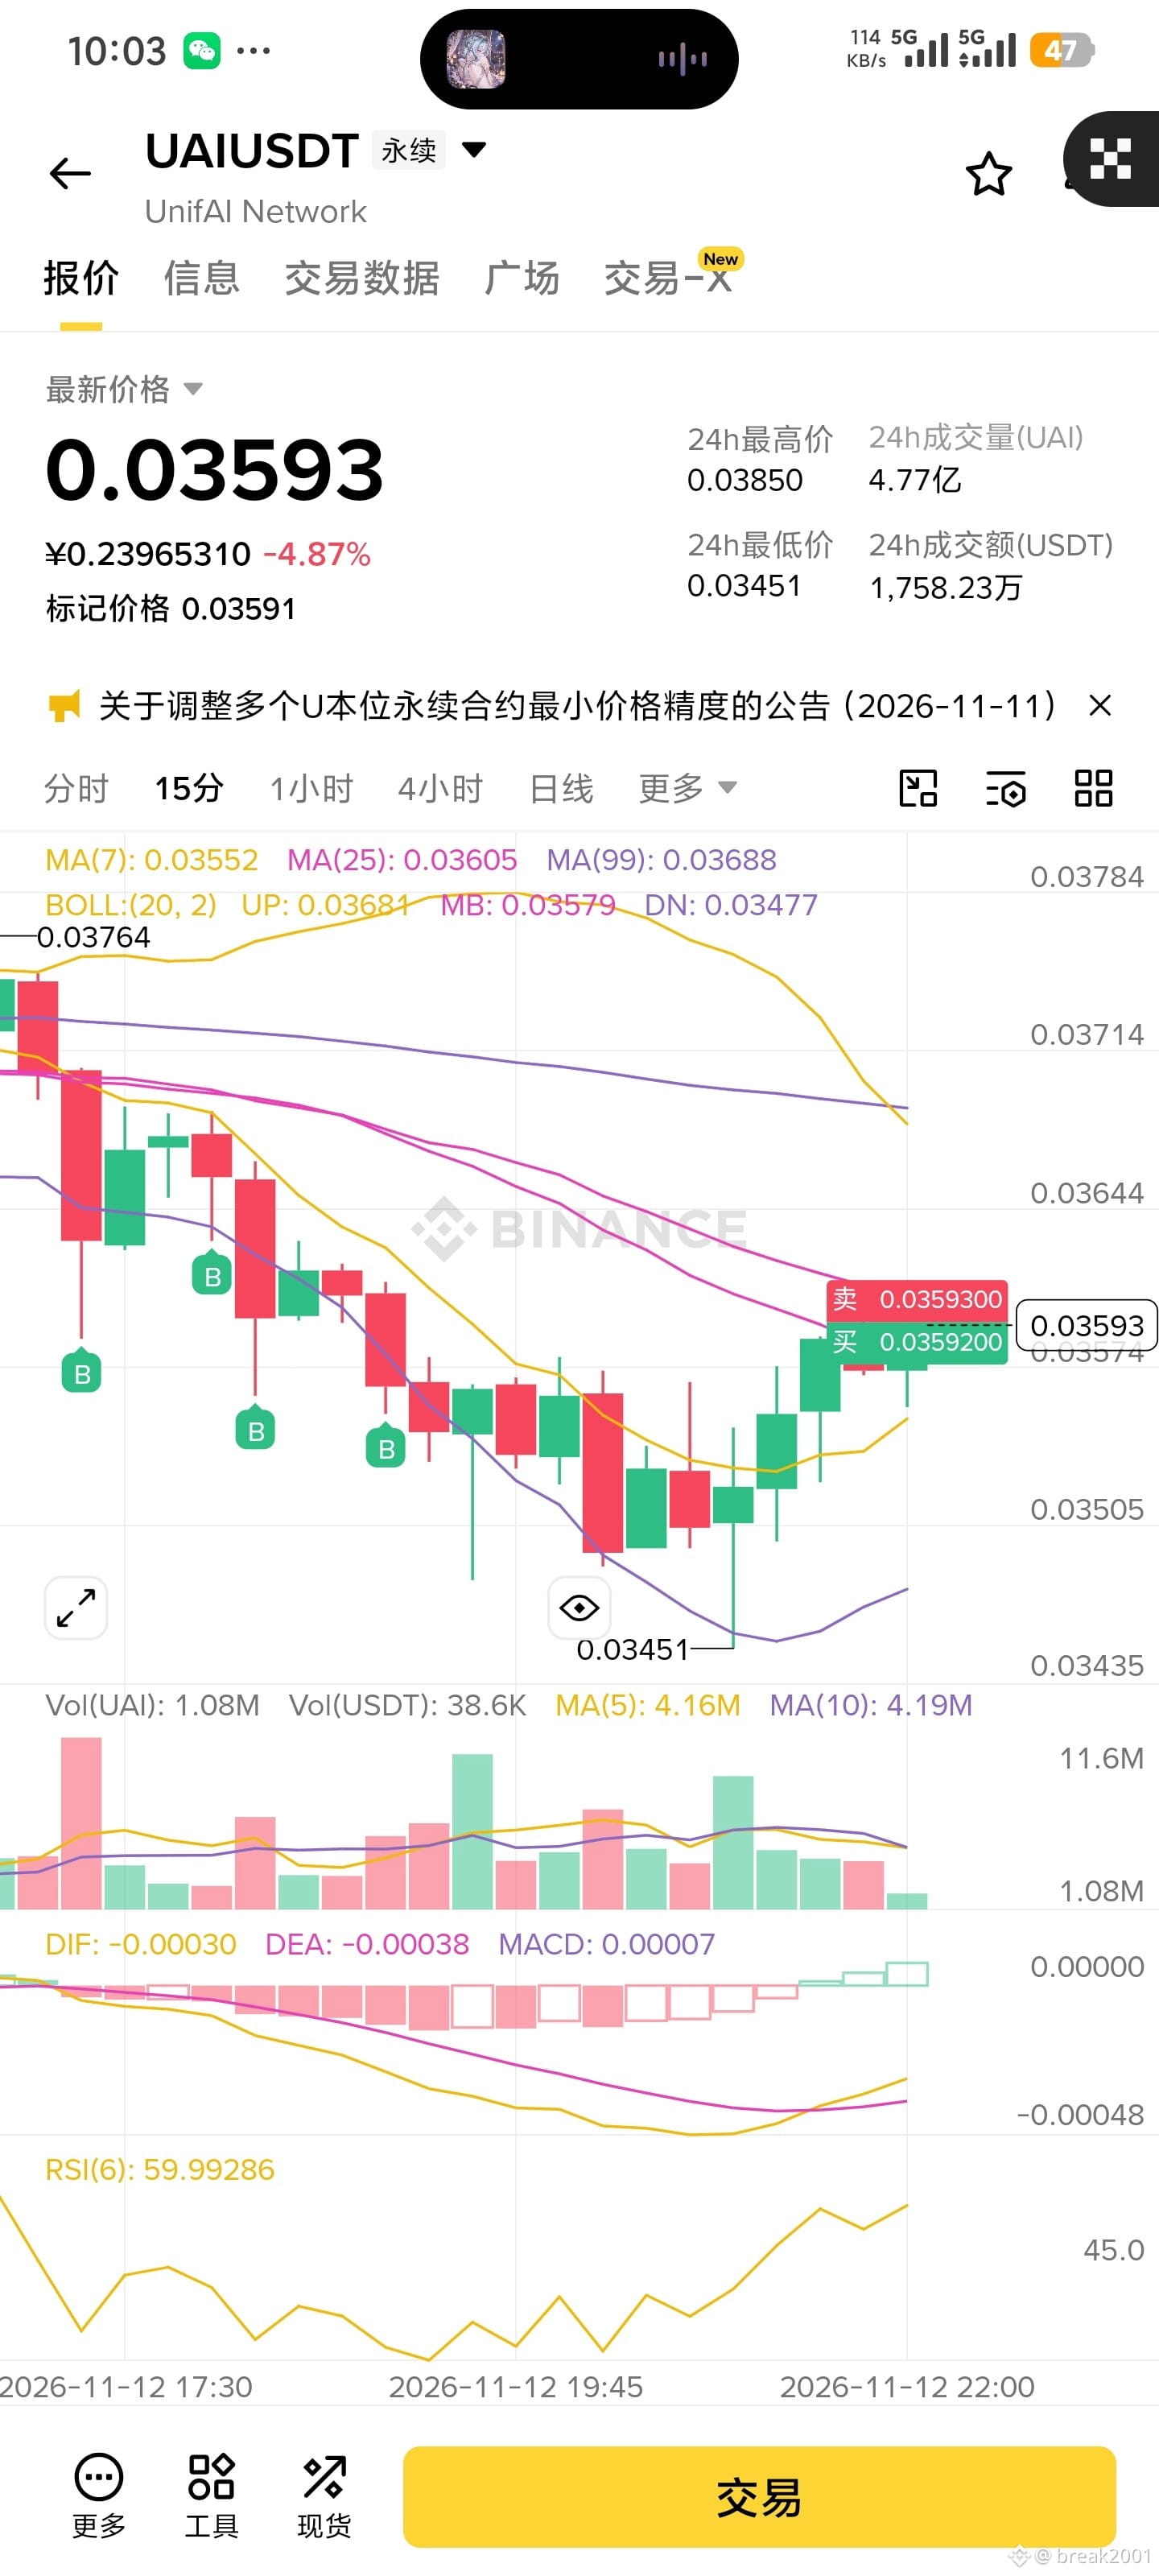
· Current price: 0.03593 USDT, down 4.87% over 24 hours.
· 24-hour high and low: High 0.03850, low 0.03451. The current price is in the lower-middle part of the 24-hour range.
· Special announcement: A news flash above the chart reads, “Announcement on Adjusting the Minimum Price Precision of Multiple USDT-Margined Perpetual Contracts.” Such adjustments can occasionally cause minor price jumps on the chart, but usually do not affect major technical trends.
2. Technical Chart Features (15-minute timeframe)
· Candlestick patterns and trend:
· Earlier, the price underwent a sharp decline, falling from around 0.0376 to a low of 0.03451.
· After touching the bottom, the price has now staged a V-shaped rebound.
· “B” markers: There are many green “B” letters on the chart. These are typically “buy signals” marked by trading software, or grid/DCA buy points set by users. Looking at the candlesticks in this rebound from the bottom, these “B” markers did indeed catch the short-term rebound gains.
· Moving average system (MA):
· MA(7) = 0.03552 (has turned upward, indicating a warming short-term trend).
· MA(25) = 0.03605 (the current price is trying to challenge this moving average).
· MA(99) = 0.03688 (the long-term moving average is still exerting downward pressure).
· Assessment: The price has successfully moved above MA7 and is currently testing resistance at MA25.
· Bollinger Bands (BOLL):
· The price previously fell below the lower Bollinger Band (DN: 0.03477), then quickly recovered back inside the band. This is a classic “false breakdown,” also commonly known as a “bear trap.” The price is now approaching the middle band (MB: 0.03579) and has already moved above it.
· Trading volume (Vol):
· A clear spike in volume appeared near the bottom at 0.03451. The increase in volume means that buyers stepped in as panic selling emerged.
· During the rebound, trading volume has been relatively moderate, which is a normal volume-price pattern for an “oversold rebound.”
· MACD indicator (key signal):
· DIF crossed above DEA below the zero line, forming a golden cross.
· The red MACD histogram bars turned green (bullish).
· This is a very typical short-term bullish reversal signal, indicating that downward momentum has weakened and rebound momentum is beginning.
· RSI(6) indicator:
· The value is 59.99
1. Basic Market Information
· Trading pair: UAI/USDT perpetual contract (UnifAI Network).
· Current price: 0.03593 USDT, down 4.87% over 24 hours.
· 24-hour high and low: High 0.03850, low 0.03451. The current price is in the lower-middle part of the 24-hour range.
· Special announcement: A news flash above the chart reads, “Announcement on Adjusting the Minimum Price Precision of Multiple USDT-Margined Perpetual Contracts.” Such adjustments can occasionally cause minor price jumps on the chart, but usually do not affect major technical trends.
2. Technical Chart Features (15-minute timeframe)
· Candlestick patterns and trend:
· Earlier, the price underwent a sharp decline, falling from around 0.0376 to a low of 0.03451.
· After touching the bottom, the price has now staged a V-shaped rebound.
· “B” markers: There are many green “B” letters on the chart. These are typically “buy signals” marked by trading software, or grid/DCA buy points set by users. Looking at the candlesticks in this rebound from the bottom, these “B” markers did indeed catch the short-term rebound gains.
· Moving average system (MA):
· MA(7) = 0.03552 (has turned upward, indicating a warming short-term trend).
· MA(25) = 0.03605 (the current price is trying to challenge this moving average).
· MA(99) = 0.03688 (the long-term moving average is still exerting downward pressure).
· Assessment: The price has successfully moved above MA7 and is currently testing resistance at MA25.
· Bollinger Bands (BOLL):
· The price previously fell below the lower Bollinger Band (DN: 0.03477), then quickly recovered back inside the band. This is a classic “false breakdown,” also commonly known as a “bear trap.” The price is now approaching the middle band (MB: 0.03579) and has already moved above it.
· Trading volume (Vol):
· A clear spike in volume appeared near the bottom at 0.03451. The increase in volume means that buyers stepped in as panic selling emerged.
· During the rebound, trading volume has been relatively moderate, which is a normal volume-price pattern for an “oversold rebound.”
· MACD indicator (key signal):
· DIF crossed above DEA below the zero line, forming a golden cross.
· The red MACD histogram bars turned green (bullish).
· This is a very typical short-term bullish reversal signal, indicating that downward momentum has weakened and rebound momentum is beginning.
· RSI(6) indicator:
· The value is 59.99