🚀 ERA/USDT Market Analysis: The Bulls Are Back in Control
$ERA
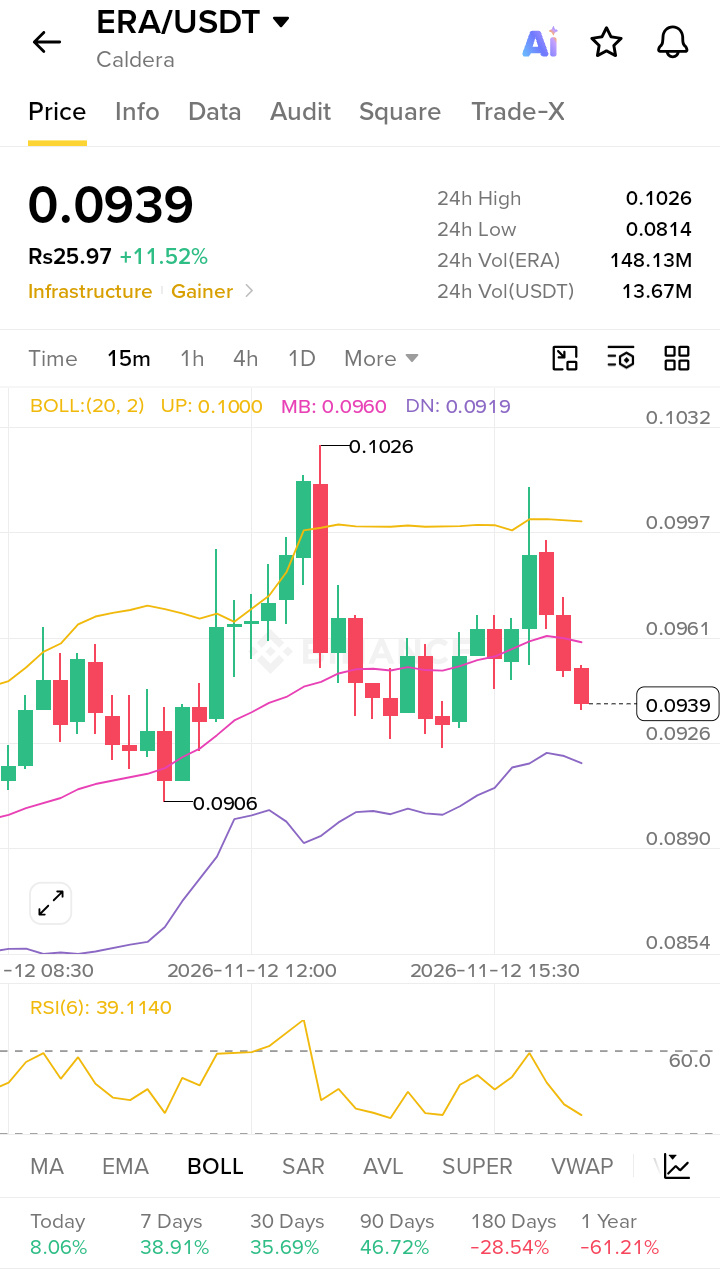
The Caldera (ERA) ecosystem is heating up! After a period of consolidation, ERA/USDT has staged a massive breakout, currently trading at $0.0939—a surge of +11.52% in just 24 hours. With over 148M ERA in trading volume, this isn’t just a retail pump; it’s a calculated move backed by strong fundamentals.
Here is a deep dive into why the price is exploding
🐋 On-Chain Whale Data & ETF Flows
Institutional interest is spiking. Recent data suggests large wallet holders have aggressively accumulated ERA over the past 48 hours, viewing the sub-$0.09 level as a "generational buy." With capital rotating from major ETFs into high-utility infrastructure altcoins, Caldera is seeing substantial inflow, reducing exchange supply.
📈 Technical Breakout & Key Levels
The 1D chart shows a clear shift in market structure. The price has successfully reclaimed the Bollinger Band Moving Average (MB) at $0.0960 in the short term.
Major Support
The floor is firmly established at $0.0906, aligning with the lower Bollinger Band.
Key Resistance
The immediate ceiling is the 24h high of $0.1026. A decisive daily candle close above this level opens the floodgates for a rally toward $0.1100.
Watch the RSI
Currently at 39.11, the Relative Strength Index shows there is still plenty of room for upward momentum before hitting overbought territory.
💥 Derivatives Short Liquidations
The recent "green candles" have triggered a cascade of short liquidations. Bears who bet against ERA at the $0.09 support were forced to cover their positions, creating a "short squeeze" that fueled the rapid move to current highs.
Target to Watch
If bulls maintain volume, $0.1026 is the breakout gatekeeper.
Please don’t forget to like, follow, and share! 🩸 Thank you so much ❤️
#HuangRisksOusterOverReportedAffairWithSubordinate #CanNvidiaEarningsEaseMarketConcerns? #PythAddsNYSERealTimeDataToMarketplace
$ERA
The Caldera (ERA) ecosystem is heating up! After a period of consolidation, ERA/USDT has staged a massive breakout, currently trading at $0.0939—a surge of +11.52% in just 24 hours. With over 148M ERA in trading volume, this isn’t just a retail pump; it’s a calculated move backed by strong fundamentals.
Here is a deep dive into why the price is exploding
🐋 On-Chain Whale Data & ETF Flows
Institutional interest is spiking. Recent data suggests large wallet holders have aggressively accumulated ERA over the past 48 hours, viewing the sub-$0.09 level as a "generational buy." With capital rotating from major ETFs into high-utility infrastructure altcoins, Caldera is seeing substantial inflow, reducing exchange supply.
📈 Technical Breakout & Key Levels
The 1D chart shows a clear shift in market structure. The price has successfully reclaimed the Bollinger Band Moving Average (MB) at $0.0960 in the short term.
Major Support
The floor is firmly established at $0.0906, aligning with the lower Bollinger Band.
Key Resistance
The immediate ceiling is the 24h high of $0.1026. A decisive daily candle close above this level opens the floodgates for a rally toward $0.1100.
Watch the RSI
Currently at 39.11, the Relative Strength Index shows there is still plenty of room for upward momentum before hitting overbought territory.
💥 Derivatives Short Liquidations
The recent "green candles" have triggered a cascade of short liquidations. Bears who bet against ERA at the $0.09 support were forced to cover their positions, creating a "short squeeze" that fueled the rapid move to current highs.
Target to Watch
If bulls maintain volume, $0.1026 is the breakout gatekeeper.
Please don’t forget to like, follow, and share! 🩸 Thank you so much ❤️
#HuangRisksOusterOverReportedAffairWithSubordinate #CanNvidiaEarningsEaseMarketConcerns? #PythAddsNYSERealTimeDataToMarketplace