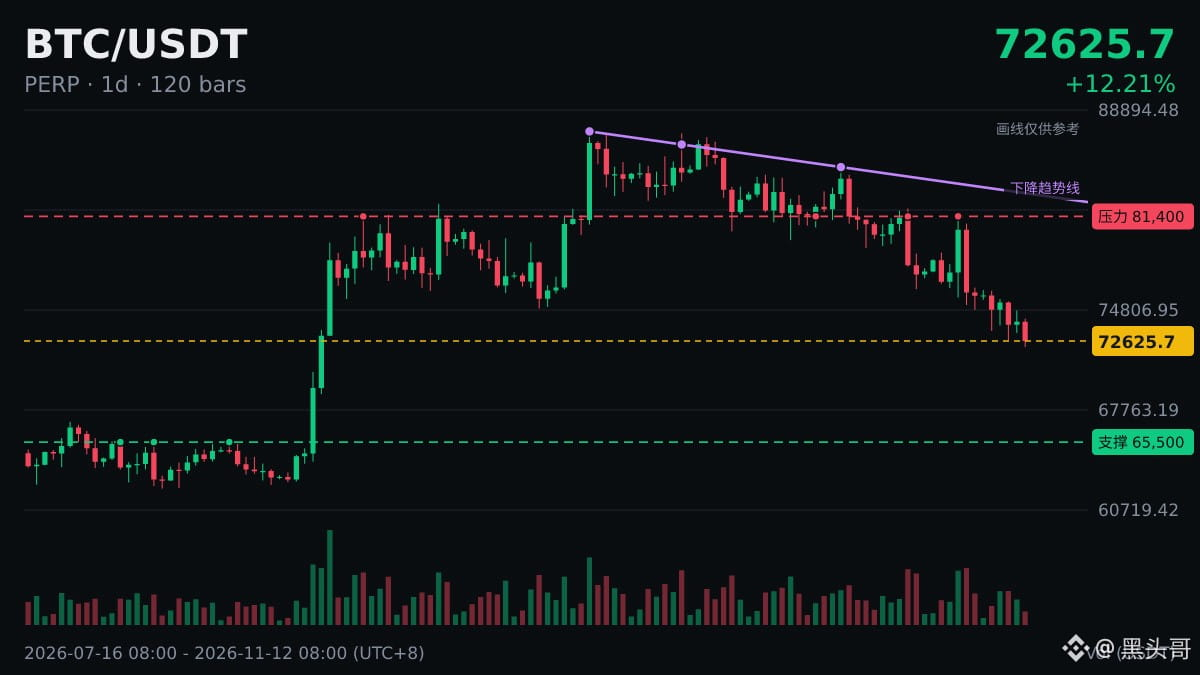
$BTC |Daily chart breaks below MA200|MA200 73108.5
Before discussing capital flows, let’s first understand moving averages.
On a daily chart, MA200 is the average closing price over the most recent 200 days and is often used as a reference for the bull or bear trend; MA50 is commonly used to assess the medium-term trend.
Whether trading volume increases when the price rises above or falls below a moving average is also used as a signal: a low-volume break is more likely to be just a temporary fluctuation.
Unusual data usually indicates more intense volatility. At times like these, it’s even more important to reduce leverage rather than increase it.
Before discussing capital flows, let’s first understand moving averages.
On a daily chart, MA200 is the average closing price over the most recent 200 days and is often used as a reference for the bull or bear trend; MA50 is commonly used to assess the medium-term trend.
Whether trading volume increases when the price rises above or falls below a moving average is also used as a signal: a low-volume break is more likely to be just a temporary fluctuation.
Unusual data usually indicates more intense volatility. At times like these, it’s even more important to reduce leverage rather than increase it.