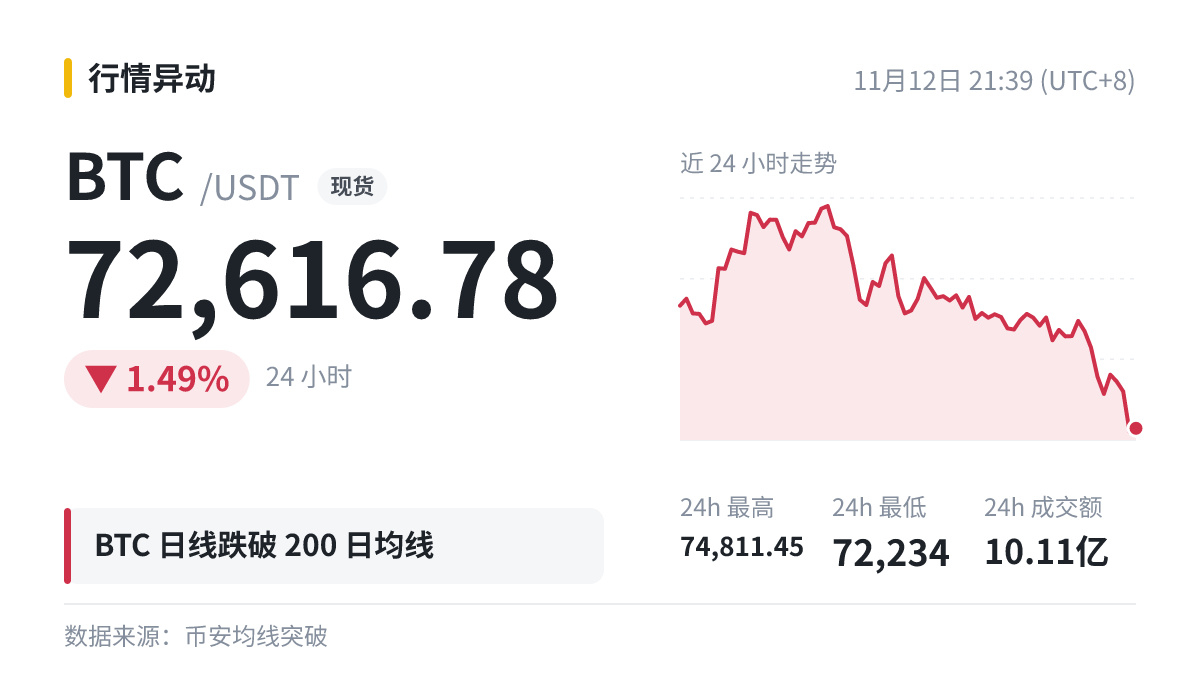
Indicator note|$BTC |Daily chart breaks below MA200|MA200 73108.6
Definition: Long-term moving averages like the MA200 attract widespread attention, partly because so many people are watching them. When the price approaches this line, reactions are often more pronounced.
How to read it: A moving average is simply a line calculated from average prices. It has no special power in itself; often, it attracts attention because so many people are watching it.
Before trading with leverage, first consider whether you can handle the worst-case outcome, then look at what the signal is saying.
Definition: Long-term moving averages like the MA200 attract widespread attention, partly because so many people are watching them. When the price approaches this line, reactions are often more pronounced.
How to read it: A moving average is simply a line calculated from average prices. It has no special power in itself; often, it attracts attention because so many people are watching it.
Before trading with leverage, first consider whether you can handle the worst-case outcome, then look at what the signal is saying.