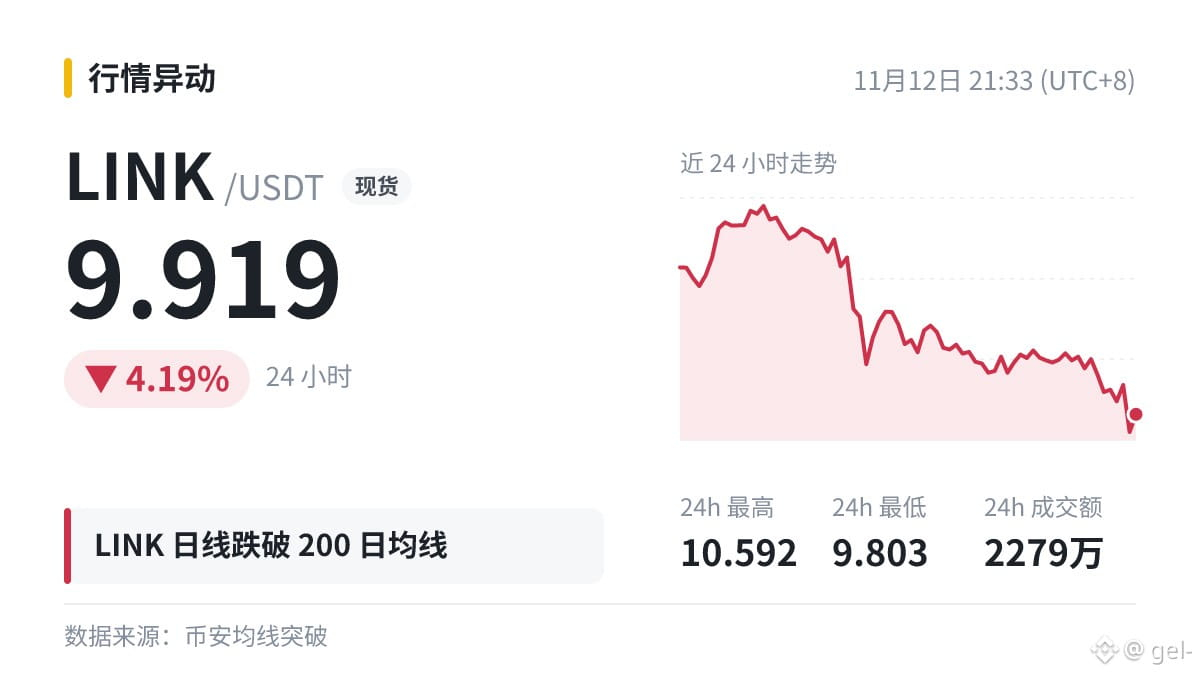
$LINK daily chart fell below MA200 (10.1007), down 4.19% over 24h.
Let’s use this figure to talk about moving averages.
Moving averages are calculated from past prices, so they inherently lag behind: the longer the period, the smoother the moving average and the slower it is to turn.
In sideways markets, prices often cross back and forth over moving averages, so signals from moving above or below them are often false. Moving averages work better in one-way trends.
With leveraged trading, first work out whether you can handle the worst-case scenario, then consider what the signals are telling you.
Just sharing some thoughts—make your own decisions about buying and selling.
Let’s use this figure to talk about moving averages.
Moving averages are calculated from past prices, so they inherently lag behind: the longer the period, the smoother the moving average and the slower it is to turn.
In sideways markets, prices often cross back and forth over moving averages, so signals from moving above or below them are often false. Moving averages work better in one-way trends.
With leveraged trading, first work out whether you can handle the worst-case scenario, then consider what the signals are telling you.
Just sharing some thoughts—make your own decisions about buying and selling.