$FET is trading around $0.148.
And this weekly chart is showing a setup that could become very interesting.
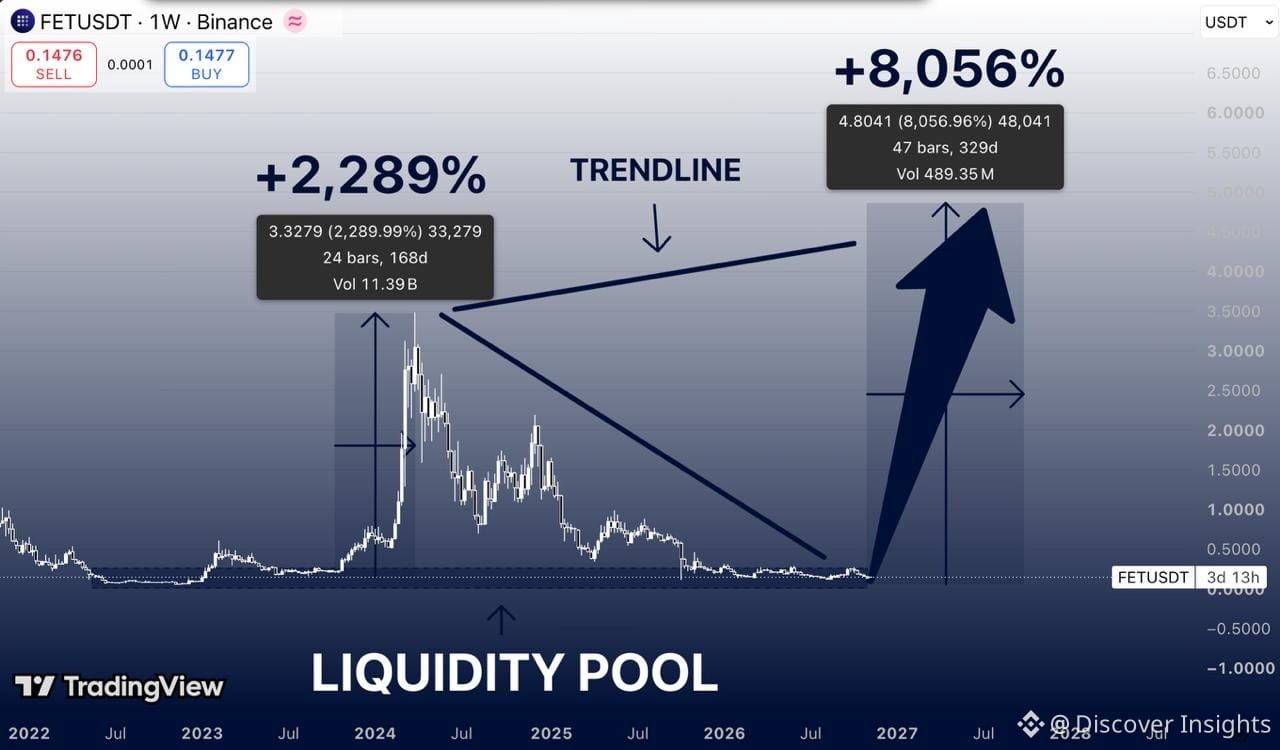
Back in 2024, FET delivered an explosive 2,289% rally in just 168 days.
From a prolonged consolidation near the lows to above $3.
Then came the correction.
Lower highs. Failed recoveries. Nearly two years of persistent selling pressure.
But look at where price is now.
FET has returned to the same broad historical price region where its previous massive rally began.
And that's exactly what caught my attention.
The market is consolidating near a long-term liquidity zone, while the descending resistance line is approaching the current price range.
Could another major expansion be developing?
Possibly. But the market still needs to confirm it.
Here's my roadmap.
$0.30 — First resistance to reclaim.
$0.75–1.00 — Next major recovery zone.
$2.00 — Potential continuation target.
$3.30 — Previous major high.
$4.30 — Long-term upside objective.
And $5? That's my extreme bull scenario.
The chart illustrates a potential 8,056% move from its marked historical base.
That's an extraordinary projection.
And it would require a complete reversal of the long-term bearish structure, sustained buying demand, and a major expansion in market liquidity.
First, I want to see FET establish higher lows and reclaim $0.30 on the weekly timeframe.
Then a decisive breakout above $0.75 would strengthen the case for a larger trend reversal.
Without those confirmations, the broader bearish structure remains intact.
In 2024, traders were chasing FET above $3.
Now it's near $0.15, and the excitement has almost completely disappeared.
That doesn't automatically make it undervalued.
But if buyers finally defend this historical base and break the sequence of lower highs, FET could become one of the more interesting recovery setups to watch.
I'm not calling for an 80x rally.
I'm watching whether the market is finally change in trend.
#HuangRisksOusterOverReportedAffairWithSubordinate
$FET
And this weekly chart is showing a setup that could become very interesting.
Back in 2024, FET delivered an explosive 2,289% rally in just 168 days.
From a prolonged consolidation near the lows to above $3.
Then came the correction.
Lower highs. Failed recoveries. Nearly two years of persistent selling pressure.
But look at where price is now.
FET has returned to the same broad historical price region where its previous massive rally began.
And that's exactly what caught my attention.
The market is consolidating near a long-term liquidity zone, while the descending resistance line is approaching the current price range.
Could another major expansion be developing?
Possibly. But the market still needs to confirm it.
Here's my roadmap.
$0.30 — First resistance to reclaim.
$0.75–1.00 — Next major recovery zone.
$2.00 — Potential continuation target.
$3.30 — Previous major high.
$4.30 — Long-term upside objective.
And $5? That's my extreme bull scenario.
The chart illustrates a potential 8,056% move from its marked historical base.
That's an extraordinary projection.
And it would require a complete reversal of the long-term bearish structure, sustained buying demand, and a major expansion in market liquidity.
First, I want to see FET establish higher lows and reclaim $0.30 on the weekly timeframe.
Then a decisive breakout above $0.75 would strengthen the case for a larger trend reversal.
Without those confirmations, the broader bearish structure remains intact.
In 2024, traders were chasing FET above $3.
Now it's near $0.15, and the excitement has almost completely disappeared.
That doesn't automatically make it undervalued.
But if buyers finally defend this historical base and break the sequence of lower highs, FET could become one of the more interesting recovery setups to watch.
I'm not calling for an 80x rally.
I'm watching whether the market is finally change in trend.
#HuangRisksOusterOverReportedAffairWithSubordinate
$FET