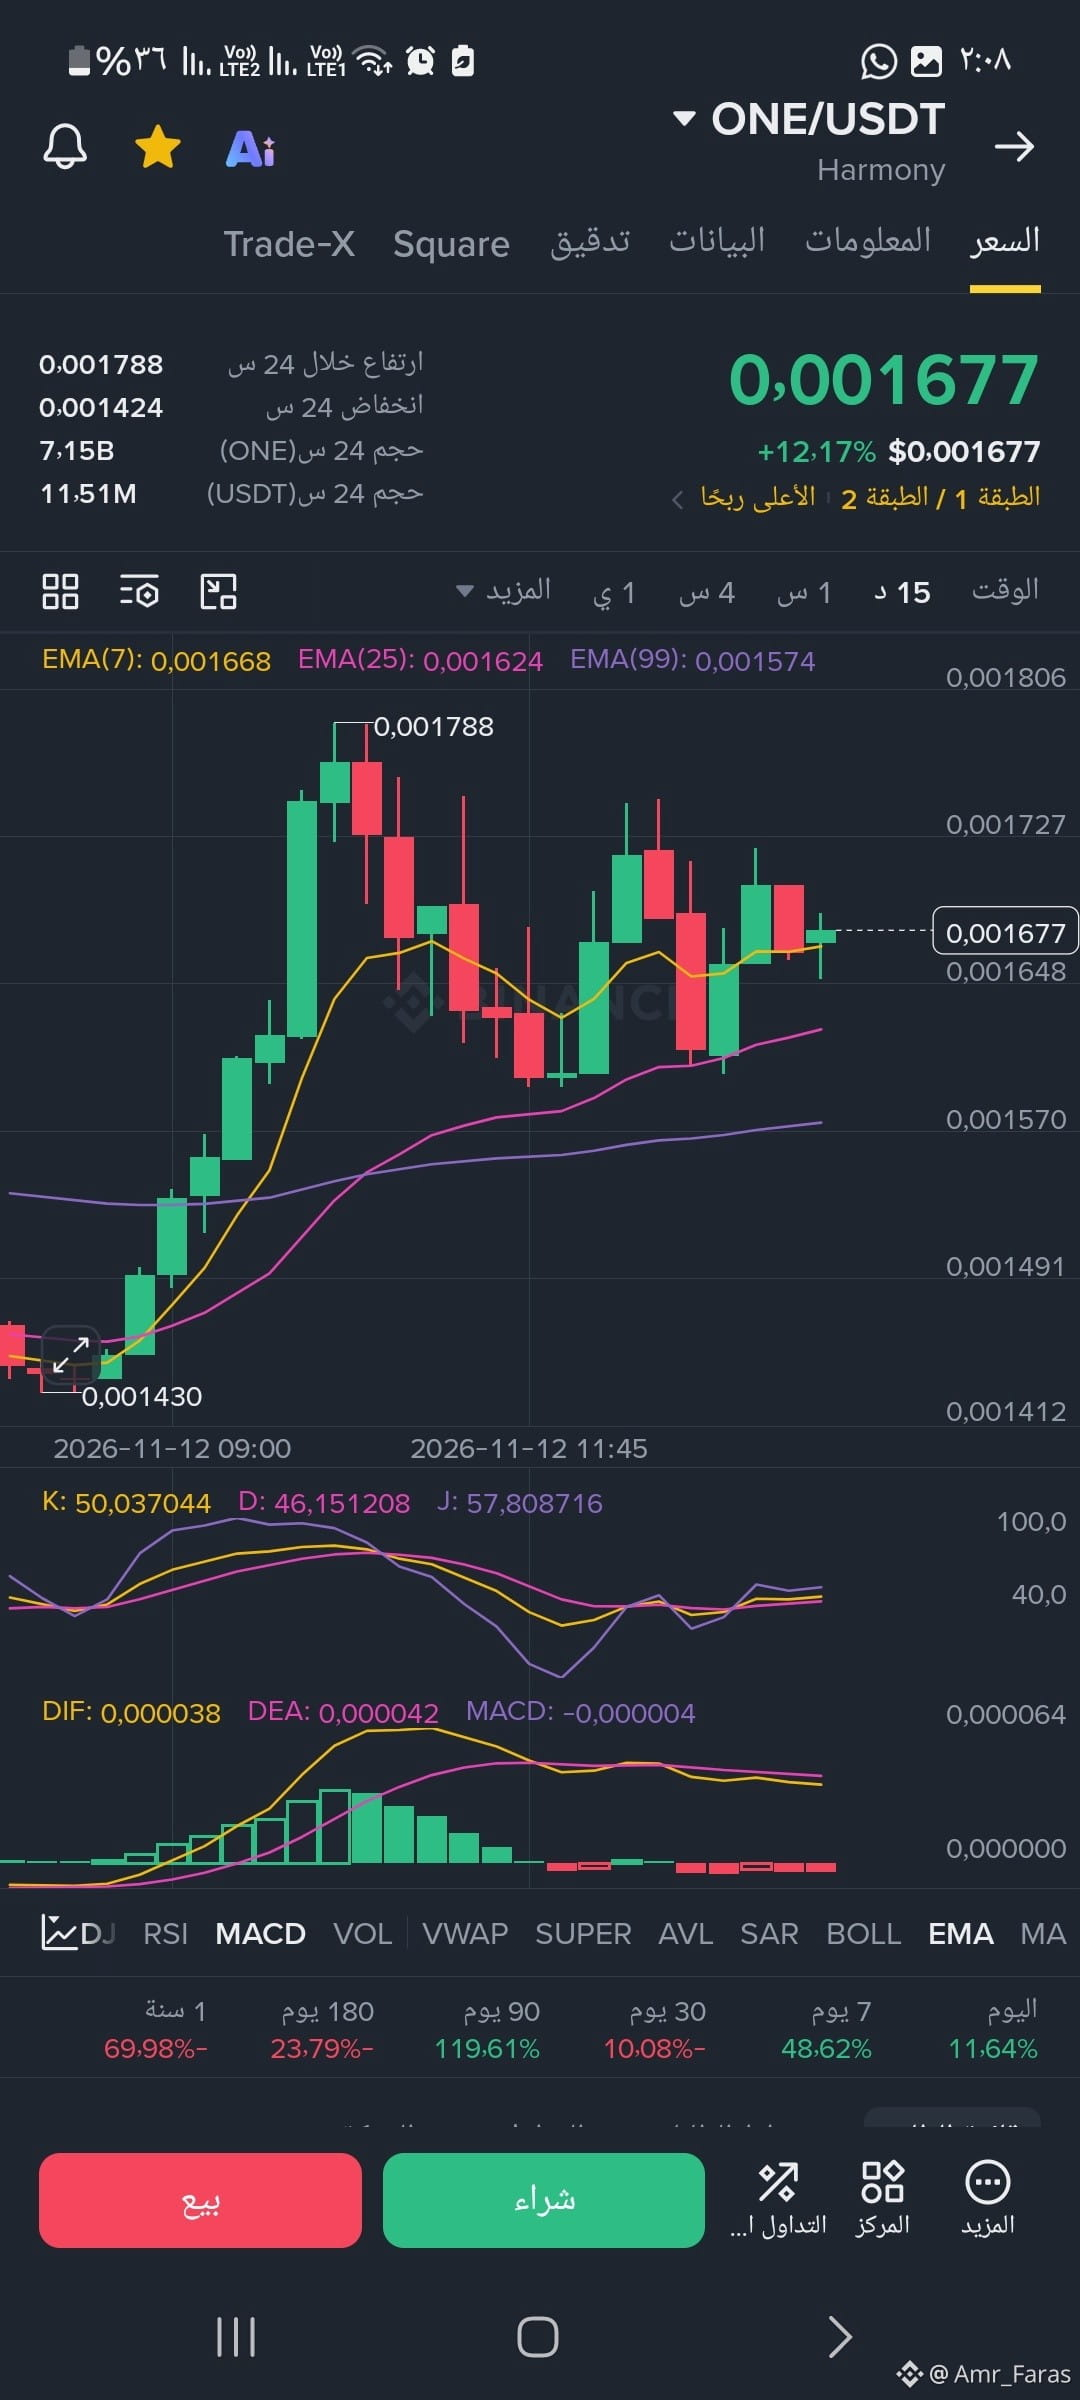
#one • Price and momentum rise: The price climbed from $0.001672 to $0.001677, raising daily gains from +11.84% to +12.17%, with a new green candle forming above the fast EMA 7 (0.001668).
• KDJ indicator improves: The indicator continued its positive rise (K increased to 50.03 and J to 57.80, compared with 48.95 and 55.28 previously), confirming a gradual increase in buying momentum.
• MACD indicator: Negative MACD narrowed to -0.000004 (compared with -0.000005 previously) and is close to a bullish crossover above the zero line.
• Current levels to watch: The 0.001668–0.001648 range remains the immediate support zone, while a break above 0.001727 would signal confirmation of a retest of the daily high at $0.001788.
Price action and technical indicators analysis
• KDJ indicator improves: The indicator continued its positive rise (K increased to 50.03 and J to 57.80, compared with 48.95 and 55.28 previously), confirming a gradual increase in buying momentum.
• MACD indicator: Negative MACD narrowed to -0.000004 (compared with -0.000005 previously) and is close to a bullish crossover above the zero line.
• Current levels to watch: The 0.001668–0.001648 range remains the immediate support zone, while a break above 0.001727 would signal confirmation of a retest of the daily high at $0.001788.
Price action and technical indicators analysis