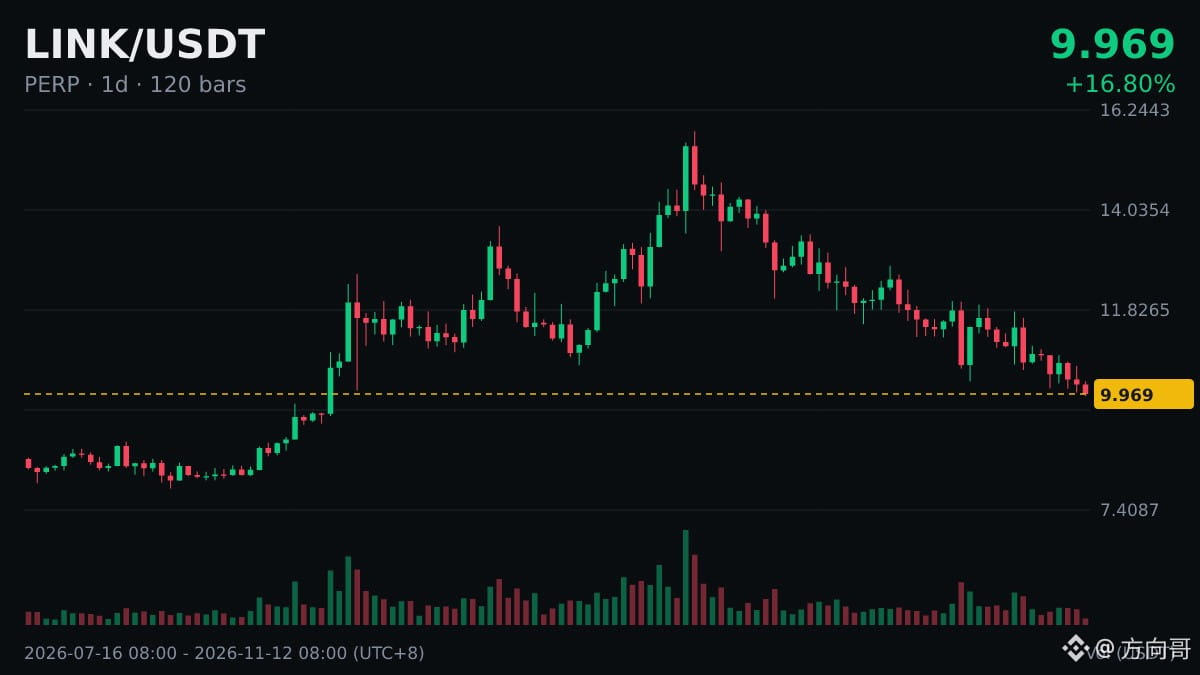
$LINK The daily chart has broken below MA200 (10.1007), with the current price at 9.987.
The daily MA200 has long been regarded as the dividing line between bull and bear markets. After a break below it, the key thing to watch is whether a rebound can reclaim the moving average. If it fails to, the moving average turns from support into resistance.
How would you respond?
#LINK
The daily MA200 has long been regarded as the dividing line between bull and bear markets. After a break below it, the key thing to watch is whether a rebound can reclaim the moving average. If it fails to, the moving average turns from support into resistance.
How would you respond?
#LINK