$ZEC
👍Brief technical analysis based on the chart for the (ZEC/USDT) pair:
⚡Overall trend: The price is following a generally upward trajectory in the medium term, supported by moving averages (EMA) showing a gradual rise.
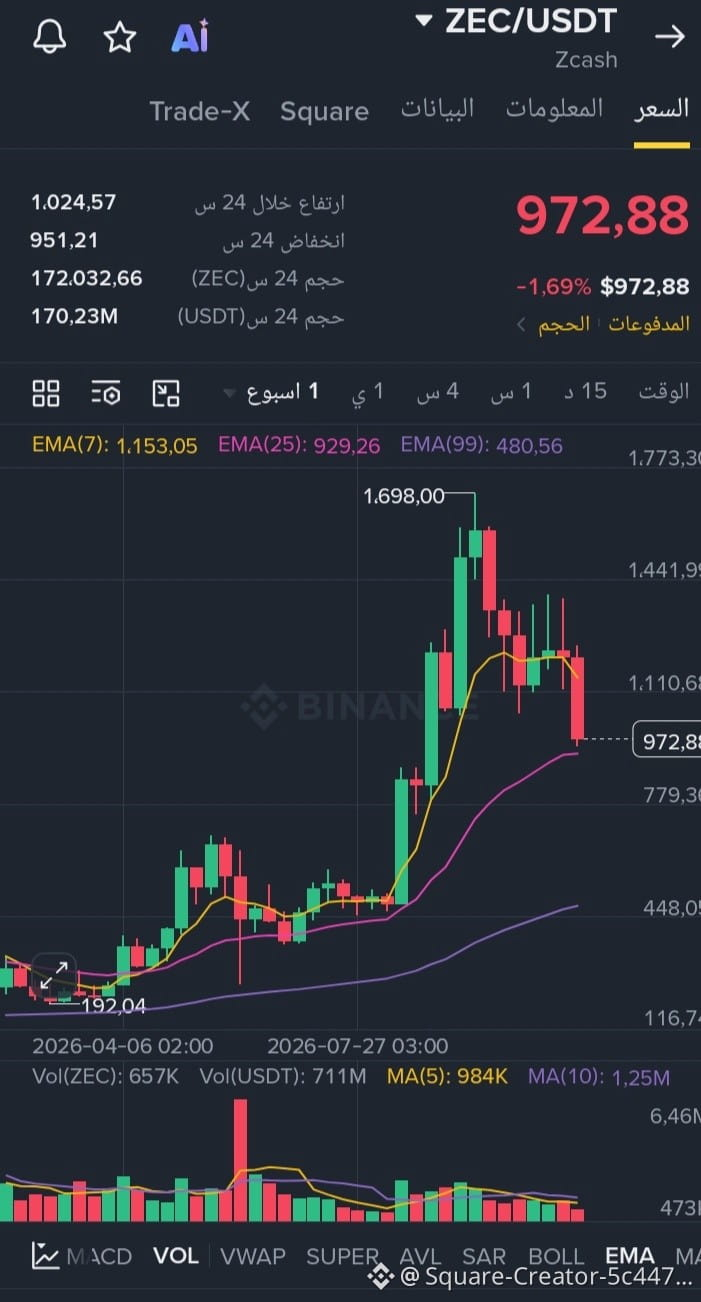
💰Current performance: The chart shows a slight downward correction of 1.69%, bringing the price to 972.88 after it reached a recent high near 1,698.00.
💥Moving averages: The price is currently trading below the (EMA 7) average at 1,153.05, but it remains above the (EMA 25) average at 929.26, which represents an important support level.
🔥Technical outlook: The price is currently at an important test zone. Holding above 929 could restore positive upward momentum, while a break below it could lead to further declines toward the longer-term averages.
👍Brief technical analysis based on the chart for the (ZEC/USDT) pair:
⚡Overall trend: The price is following a generally upward trajectory in the medium term, supported by moving averages (EMA) showing a gradual rise.
💰Current performance: The chart shows a slight downward correction of 1.69%, bringing the price to 972.88 after it reached a recent high near 1,698.00.
💥Moving averages: The price is currently trading below the (EMA 7) average at 1,153.05, but it remains above the (EMA 25) average at 929.26, which represents an important support level.
🔥Technical outlook: The price is currently at an important test zone. Holding above 929 could restore positive upward momentum, while a break below it could lead to further declines toward the longer-term averages.