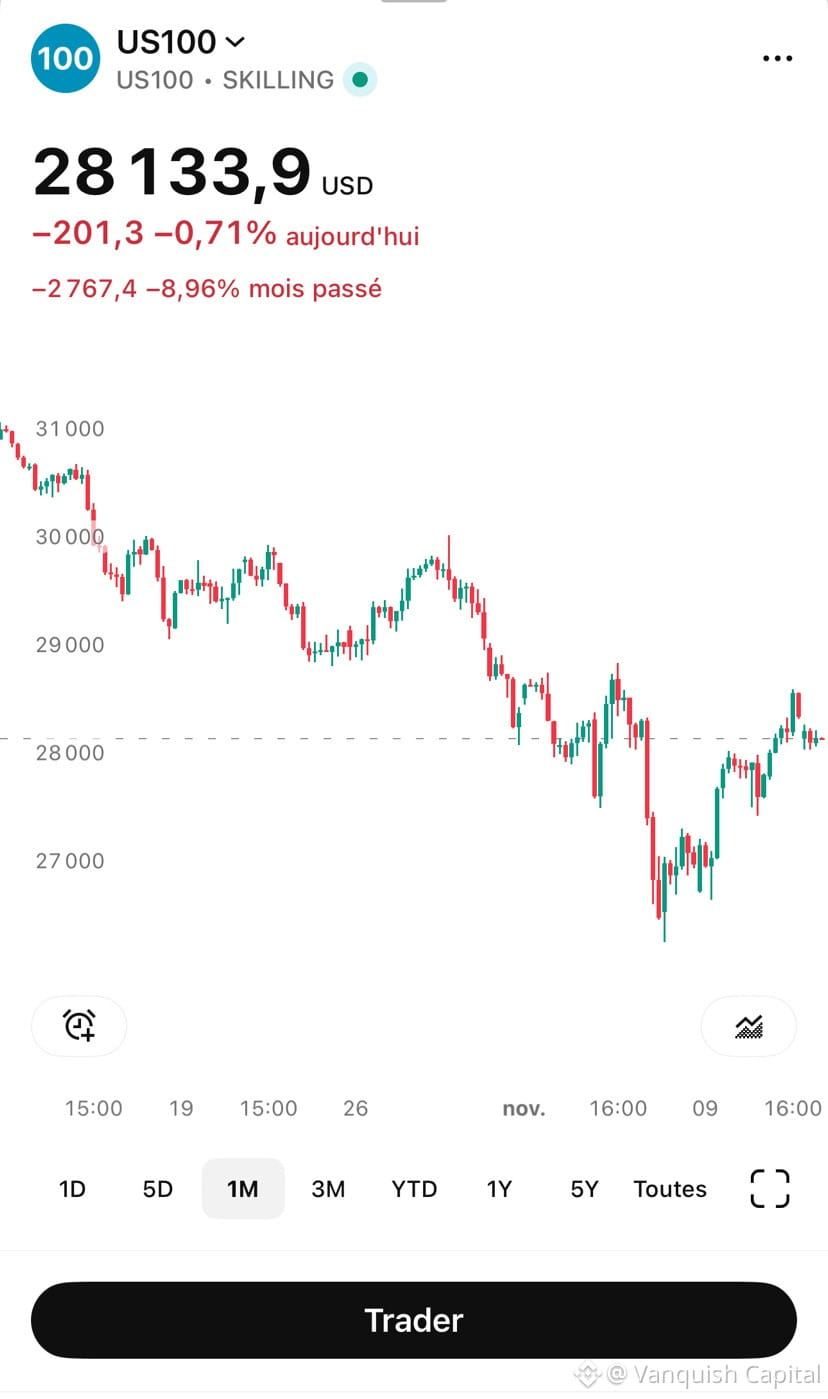
• The US 100 (Nasdaq 100) chart shows the index trading at $28,133.9, down 0.71% today (-201.3 points) and down 8.96% over the past month (-2,767.4 points).
• As for your technical outlook targeting higher levels, reaching 31,000 points, this scenario reflects a bullish view, with the possibility of a price rebound after testing the current lows. It is supported by positive momentum related to the results of some technology and AI infrastructure companies, which are trying to lead the market toward recovery despite recent technical and regulatory pressures.
$NVDA.US $AMD.US $SNDK.US
• As for your technical outlook targeting higher levels, reaching 31,000 points, this scenario reflects a bullish view, with the possibility of a price rebound after testing the current lows. It is supported by positive momentum related to the results of some technology and AI infrastructure companies, which are trying to lead the market toward recovery despite recent technical and regulatory pressures.
$NVDA.US $AMD.US $SNDK.US