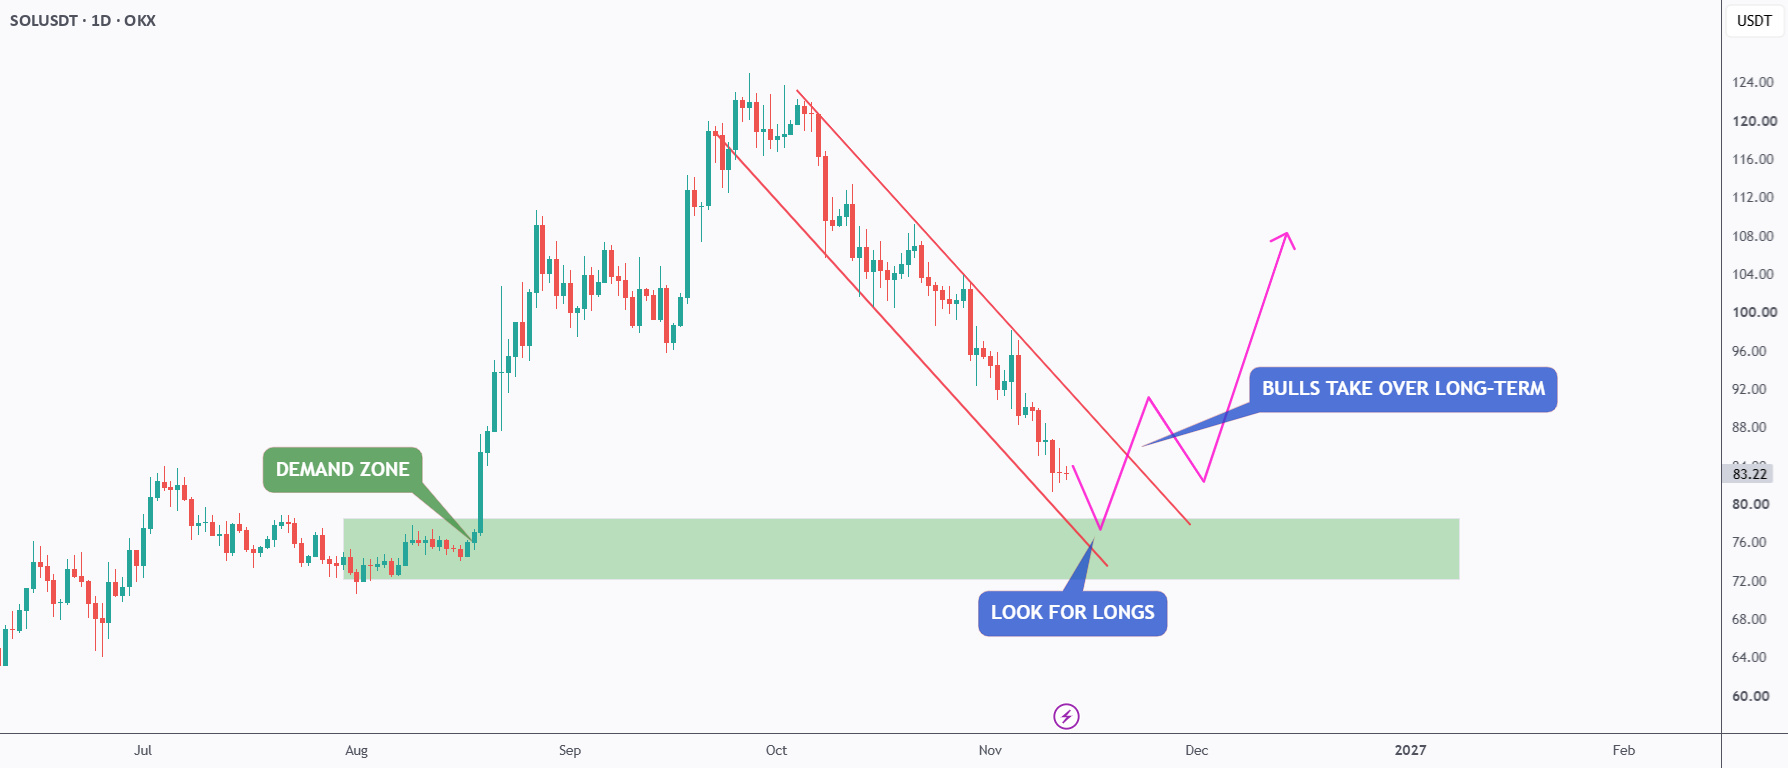


SOL has been overall bearish, trading within the falling channel marked in red.
However, following the recent bearish movement, price is approaching the lower boundary of the channel, which is considered a potential oversold area.
📊 Technical Outlook
Interestingly, the lower red trendline intersects with a strong demand zone marked in green, around $72–$78.
This creates an interesting confluence of two technical factors:
Lower Channel Boundary (Red): Acting as dynamic support and a potential oversold area.
Demand Zone (Green): A key area where buyers previously stepped in, triggering a strong bullish movement.
📈 Preferred Scenario
As long as this intersection holds, we will be looking for bullish confirmation and potential buy setups, anticipating a recovery toward the upper boundary of the falling channel.
However, for the bulls to take over in the longer term, SOL needs to break and hold above the upper red trendline.
Such a breakout would signal a potential shift in momentum from bearish to bullish, opening the door for a more sustained recovery.
📌 Important Note
A bullish reaction from the demand zone does not necessarily mean the bearish trend is over.
The first opportunity is a potential bounce from support. The bigger opportunity comes if SOL breaks above the falling channel and confirms a bullish reversal.
⚠️ Disclaimer: This analysis is for educational purposes only and does not constitute financial advice. Always manage your risk.
Plan Your Trade and Trade Your Plan. 🍀
All Strategies Are Good; If Managed Properly!