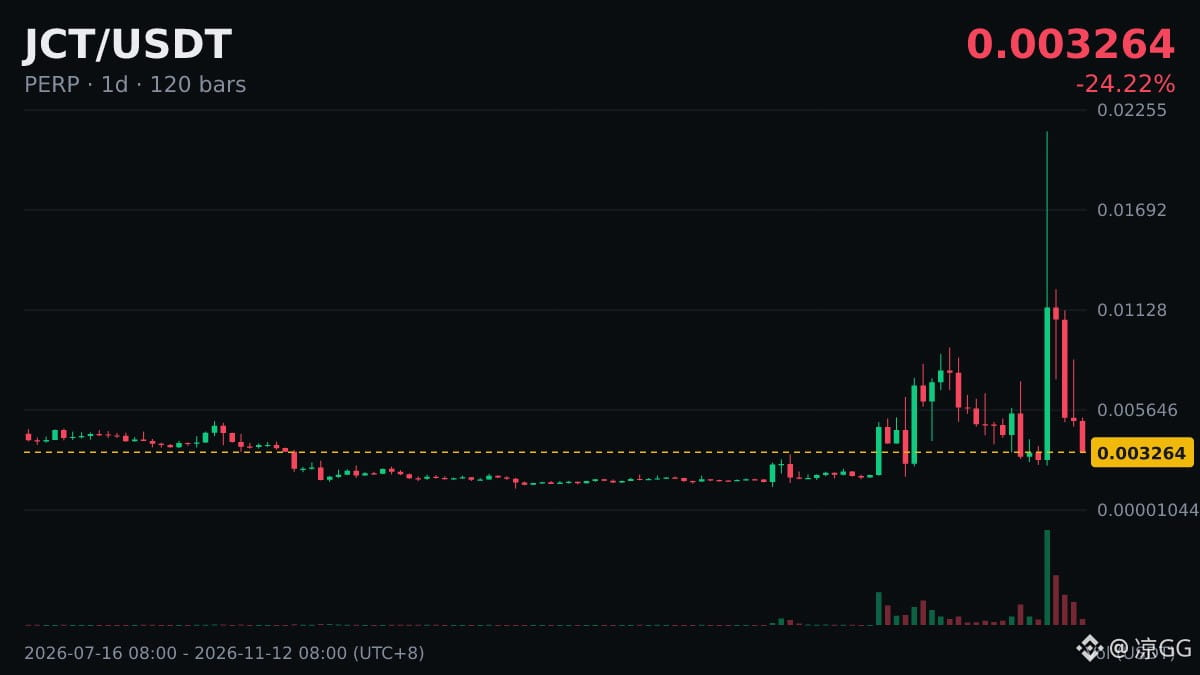
🐋 $JCT The daily chart has fallen below MA200 (0.003518), down 43.7% in 24h.
This type of moving average is a level many swing traders keep an eye on, but first, understand what it is.
To confirm a move above or below it, many people use the daily closing price. It’s common for the price to cross it intraday and then move back.
A price moving above a long-term moving average is often interpreted as a sign that the trend is strengthening, while a move below it is often seen as a sign of weakening. But a single crossing isn’t enough to tell us much.
The same reading can mean completely different things in different market conditions, so don’t blindly apply a rule of thumb.
#JCT
This type of moving average is a level many swing traders keep an eye on, but first, understand what it is.
To confirm a move above or below it, many people use the daily closing price. It’s common for the price to cross it intraday and then move back.
A price moving above a long-term moving average is often interpreted as a sign that the trend is strengthening, while a move below it is often seen as a sign of weakening. But a single crossing isn’t enough to tell us much.
The same reading can mean completely different things in different market conditions, so don’t blindly apply a rule of thumb.
#JCT