BTC at $73,400, BlackRock is dumping—are you still waiting for a rescue?
ETF outflows hit $1.4 billion in five days, BlackRock led the way out, rate-hike odds soared to 100%, and the price fell below the 200-day moving average—everyone is shouting, “BTC is heading back to $70K.” The Fear & Greed Index dropped to 28, retail traders are panic-selling, but miner reserves have already fallen to a nine-month low. Is this institutions dumping their holdings and running for the exits, or one last shakeout before the storm?
First, the surface picture: bad news keeps piling up, but the price just won’t break down.
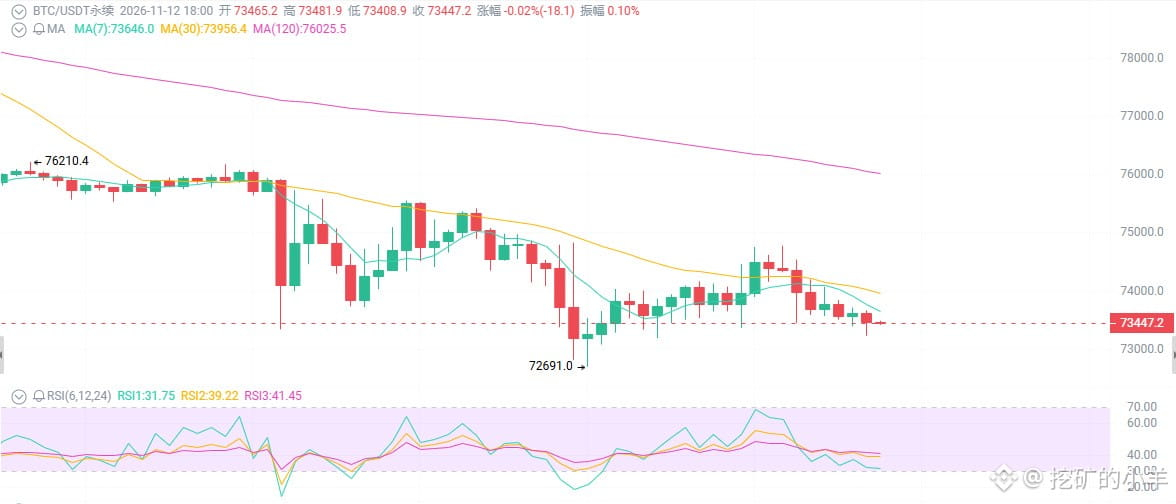
Over 24 hours, BTC bounced between $73,260 and $74,800. The weekly chart is down, and the monthly chart looks even worse. The candlesticks tell you this: the 200-day moving average is right around $73,100–$73,200, and the price has been grinding against it for three days. It won’t fall, but it won’t rise either—and that’s the most agonizing part. Can you handle a sharp crash? Can you handle this slow, grinding bleed?
First thing: BlackRock is dumping its own ETF. Think about that.
On November 11, U.S. spot Bitcoin ETFs saw net outflows of about $300 million. Who accounted for the bulk of that? BlackRock’s IBIT.
Over the past five trading days, ETFs have seen cumulative outflows of $1.44 billion. Institutions have been heading for the exits all month.
You followed the institutions into ETFs, only for them to run first.
Second thing: over with the miners, the picture is completely different.
Miner reserves have fallen to about 1.19 million BTC, a nine-month low.
Miners are running low on coins; they’ve already sold what they needed to sell. The current selling pressure isn’t coming from miners dumping—it’s ETF investors and short-term holders panic-selling.
Exchange inflows have reached a near nine-month high—meaning panicked sellers are sending their coins to exchanges, ready to cut their losses and run.
Short-term holders’ cost basis is around $75,700, and the price has been trading below it for several days. This group is down about 3% on average. Historically, once they’ve mostly finished selling, a rebound should follow.
Third thing: the technicals tell you that $72,000 is the line between life and death.
The 200-day moving average is at $73,100–$73,200, and the price is hugging it. A break below could accelerate the decline.
RSI is at 33, close to oversold, but not yet at an extreme.
MA20 is at $77,400, and MA50 is even higher—there’s a wall of bagholders overhead.
Support: $72,000–$72,500 → $70,000 → $69,000
Resistance: $74,500–$75,000 → $75,500–$76,000
If $72,000 holds, there’s still room for a rebound. If it breaks, we could see prices below $70K.
And leverage hasn’t been flushed out yet. Open interest is still high, and the funding rate is close to neutral—meaning the bulls aren’t completely dead yet. The big players may shake things out one more time before pushing the price up.
ETF outflows hit $1.4 billion in five days, BlackRock led the way out, rate-hike odds soared to 100%, and the price fell below the 200-day moving average—everyone is shouting, “BTC is heading back to $70K.” The Fear & Greed Index dropped to 28, retail traders are panic-selling, but miner reserves have already fallen to a nine-month low. Is this institutions dumping their holdings and running for the exits, or one last shakeout before the storm?
First, the surface picture: bad news keeps piling up, but the price just won’t break down.
Over 24 hours, BTC bounced between $73,260 and $74,800. The weekly chart is down, and the monthly chart looks even worse. The candlesticks tell you this: the 200-day moving average is right around $73,100–$73,200, and the price has been grinding against it for three days. It won’t fall, but it won’t rise either—and that’s the most agonizing part. Can you handle a sharp crash? Can you handle this slow, grinding bleed?
First thing: BlackRock is dumping its own ETF. Think about that.
On November 11, U.S. spot Bitcoin ETFs saw net outflows of about $300 million. Who accounted for the bulk of that? BlackRock’s IBIT.
Over the past five trading days, ETFs have seen cumulative outflows of $1.44 billion. Institutions have been heading for the exits all month.
You followed the institutions into ETFs, only for them to run first.
Second thing: over with the miners, the picture is completely different.
Miner reserves have fallen to about 1.19 million BTC, a nine-month low.
Miners are running low on coins; they’ve already sold what they needed to sell. The current selling pressure isn’t coming from miners dumping—it’s ETF investors and short-term holders panic-selling.
Exchange inflows have reached a near nine-month high—meaning panicked sellers are sending their coins to exchanges, ready to cut their losses and run.
Short-term holders’ cost basis is around $75,700, and the price has been trading below it for several days. This group is down about 3% on average. Historically, once they’ve mostly finished selling, a rebound should follow.
Third thing: the technicals tell you that $72,000 is the line between life and death.
The 200-day moving average is at $73,100–$73,200, and the price is hugging it. A break below could accelerate the decline.
RSI is at 33, close to oversold, but not yet at an extreme.
MA20 is at $77,400, and MA50 is even higher—there’s a wall of bagholders overhead.
Support: $72,000–$72,500 → $70,000 → $69,000
Resistance: $74,500–$75,000 → $75,500–$76,000
If $72,000 holds, there’s still room for a rebound. If it breaks, we could see prices below $70K.
And leverage hasn’t been flushed out yet. Open interest is still high, and the funding rate is close to neutral—meaning the bulls aren’t completely dead yet. The big players may shake things out one more time before pushing the price up.