
━━━━━━━━━━━━━━━━━━
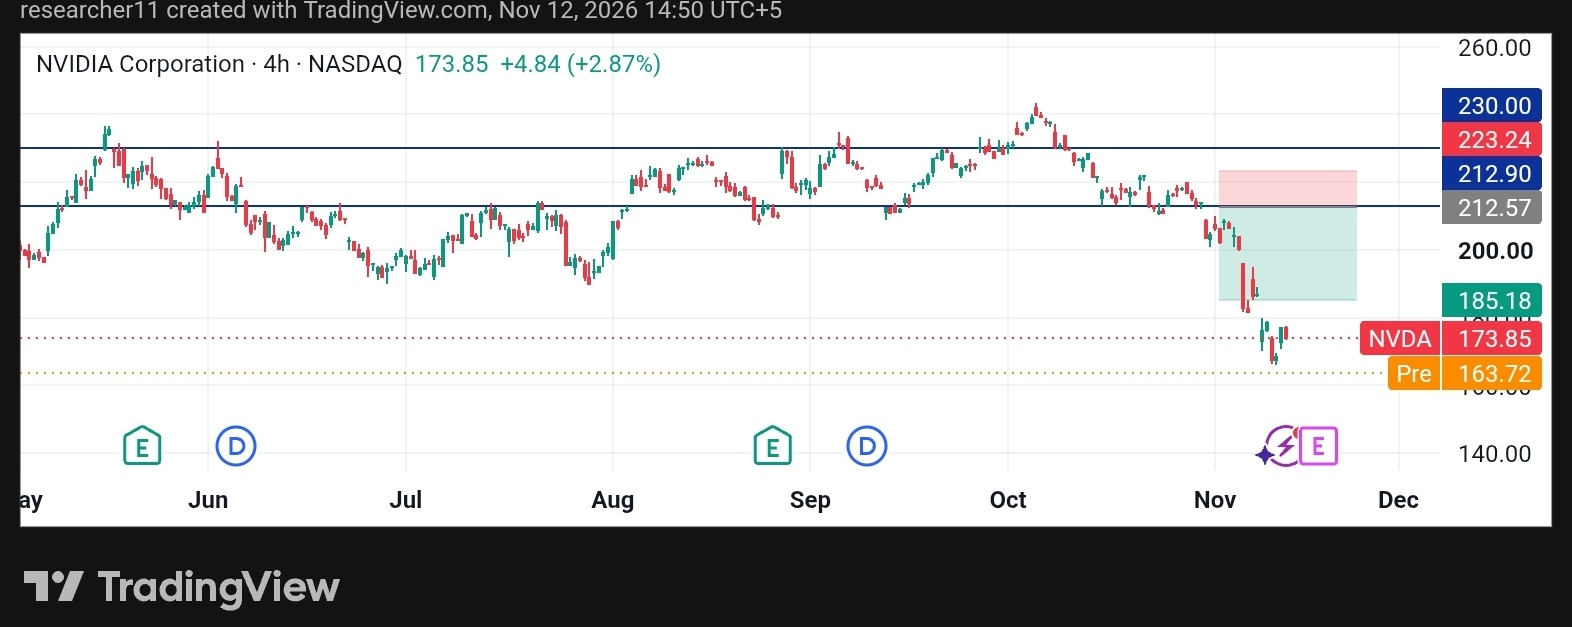
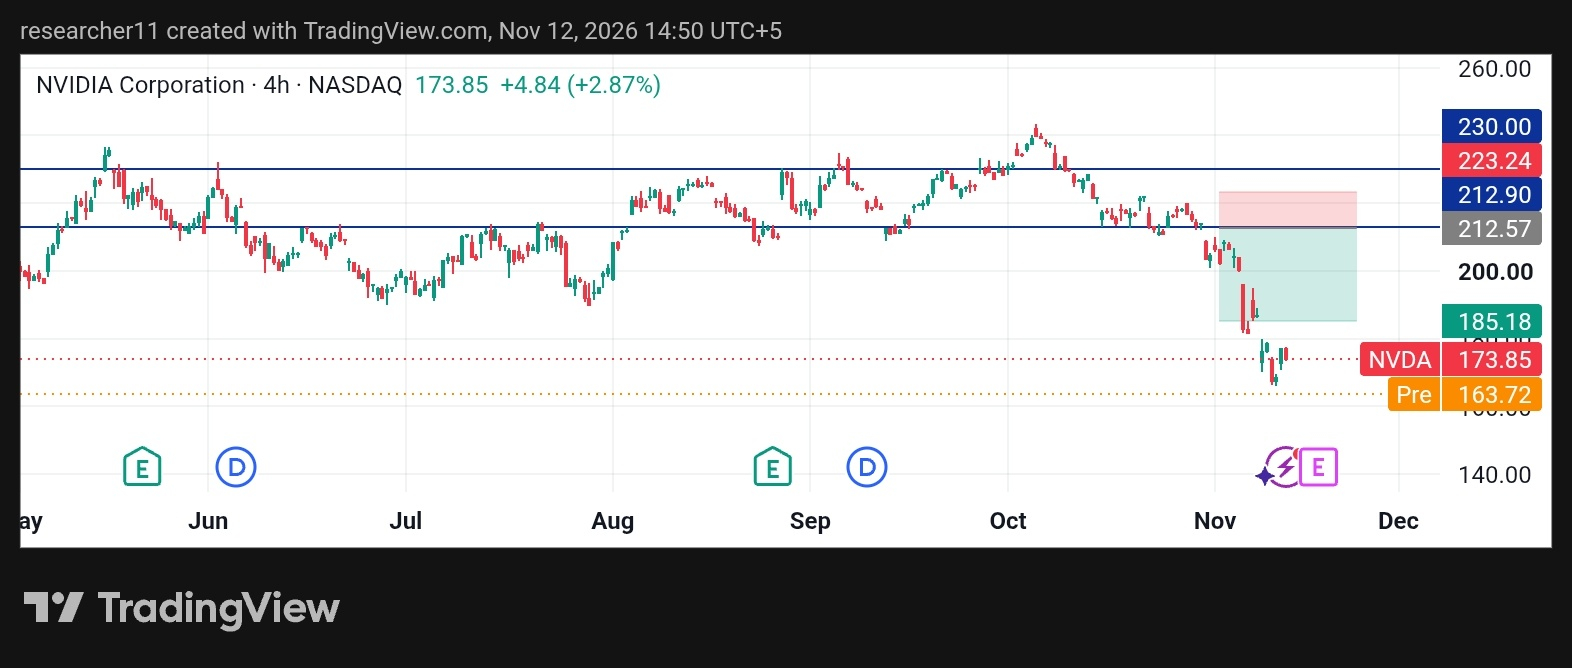
Nvidia just reminded everyone why it sits at the center of the entire tech and AI trade. The 4H chart shows a sharp slide from the October highs near $240+ into the mid-$170s, with price currently hovering around $173.85 (+2.87% on the last session) after testing lower levels. A pink resistance box sits overhead, a teal support zone sits below, and key horizontal lines mark the battlefield at roughly 223 / 213 / 185 / 164.
This isn’t just another pullback. Recent headlines around CEO Jensen Huang have added real pressure, sending after-hours and pre-market action sharply lower and dragging related perps on platforms like Hyperliquid. At the same time, fundamentals remain exceptionally strong and Wall Street’s average price targets still sit in the $300–$320 range with a Strong Buy consensus. Earnings land on November 17. The setup is high-stakes.
━━━━━━━━━━━━━━━━━━
➤ WHAT THE CHART IS TELLING US RIGHT NOW
➤ Clear lower highs and lower lows since the October peak.
➤ Price has sliced through multiple prior support zones and is now trading well below the 60-day area around $217.
➤ Highlighted pink box acts as immediate overhead supply (roughly mid-to-high $180s into low $200s).
➤ Teal zone below offers a potential demand area.
➤ Critical horizontal levels visible: ~223–230 (major prior resistance), ~212–213, ~185, and the pre-level near 163.72 that has already been tested.
RSI readings in recent sessions have dipped into oversold territory on multiple timeframes, which often precedes relief bounces — but only if buyers step in with conviction. Volume has been elevated on the downside moves, a classic sign of distribution or forced selling.
━━━━━━━━━━━━━━━━━━
KEY LEVELS TO WATCH
① Immediate resistance: 185 zone → then the pink box / 200–213 area
② Near-term support: 170–164 (pre-level and recent lows)
③ Make-or-break zone: sustained hold above 163–165 keeps the structure from accelerating lower; a clean break opens room toward deeper retracement levels.
━━━━━━━━━━━━━━━━━━
◆ LATEST MARKET SNAPSHOT
➤ Last close: ~$173.73 (+2.87%)
➤ Market cap: approximately $4.2 trillion
➤ 52-week range: $164.27 – $243.37
➤ Down roughly 23–26% over the past month
➤ Analyst consensus: Strong Buy, average 12-month target in the low-to-mid $300s (implying substantial upside from current levels if the narrative stabilizes)
➤ Next catalyst: Earnings on November 17
The stock remains the purest large-cap proxy for AI infrastructure demand. Data-center growth has been exceptional in recent quarters, yet valuation compression + leadership uncertainty + broader tech rotation have created this sharp reset.
━━━━━━━━━━━━━━━━━━
✔︎ BULL VS BEAR SCENARIOS
🟢 BULL CASE (RELIEF + RECOVERY)
Oversold conditions + strong underlying AI demand + any positive clarity around leadership or a clean earnings beat could trigger a sharp short-squeeze style bounce toward 185 → 200+. Holding the 164–170 zone is the first requirement.
🔴 BEAR CASE (CONTINUATION)
Failure to reclaim 185 and especially a breakdown below the recent pre-level / 163–165 area would open the door to deeper mean-reversion. Sentiment is fragile right now and crypto-correlated assets (including NVDA perps) have already shown how fast selling can cascade.
━━━━━━━━━━━━━━━━━━
➜ BOTTOM LINE FOR TRADERS
NVDA is no longer in the “buy every dip without thinking” phase it enjoyed for much of the AI boom. It has entered a high-volatility decision zone where technical structure, news flow, and the upcoming earnings print will decide the next multi-week direction. The chart is bearish in the short term, yet the long-term AI thesis has not been invalidated by the price action alone.
Risk management is everything here. Size positions accordingly, respect the key levels marked on the chart, and stay flexible — this name can move 5–8% in a session when catalysts hit.
━━━━━━━━━━━━━━━━━━
◆ WHAT DO YOU SEE ON THE CHART?
Are you treating the current levels as a high-conviction long opportunity, waiting for a clearer reclaim of 185+, or staying on the sidelines until after earnings?
Drop your view, key levels, or trade plan in the comments. Share this with anyone watching the AI trade — the next few sessions could set the tone for the rest of the year.
Trade safe.
#NVDA #NVIDIA #HuangRisksOusterOverReportedAffairWithSubordinate #AnthropicRejectsIPODelayValuationinQuestion $NVDAB