Technical analysis (TA) is the study of past price action and trading volume to forecast future price movements. In the volatile world of cryptocurrency trading—as illustrated by the Quack AI ($0.02685) token chart—traders rely on mathematical indicators and candlestick patterns to navigate upward and downward trends ("upar-niche wala system").
This article breaks down how to read crypto charts, analyze candlesticks, and apply the mathematical formulas driving core technical indicators like Moving Averages (MA) and Exponential Moving Averages (EMA).
1. Anatomy of a Crypto Candlestick Chart
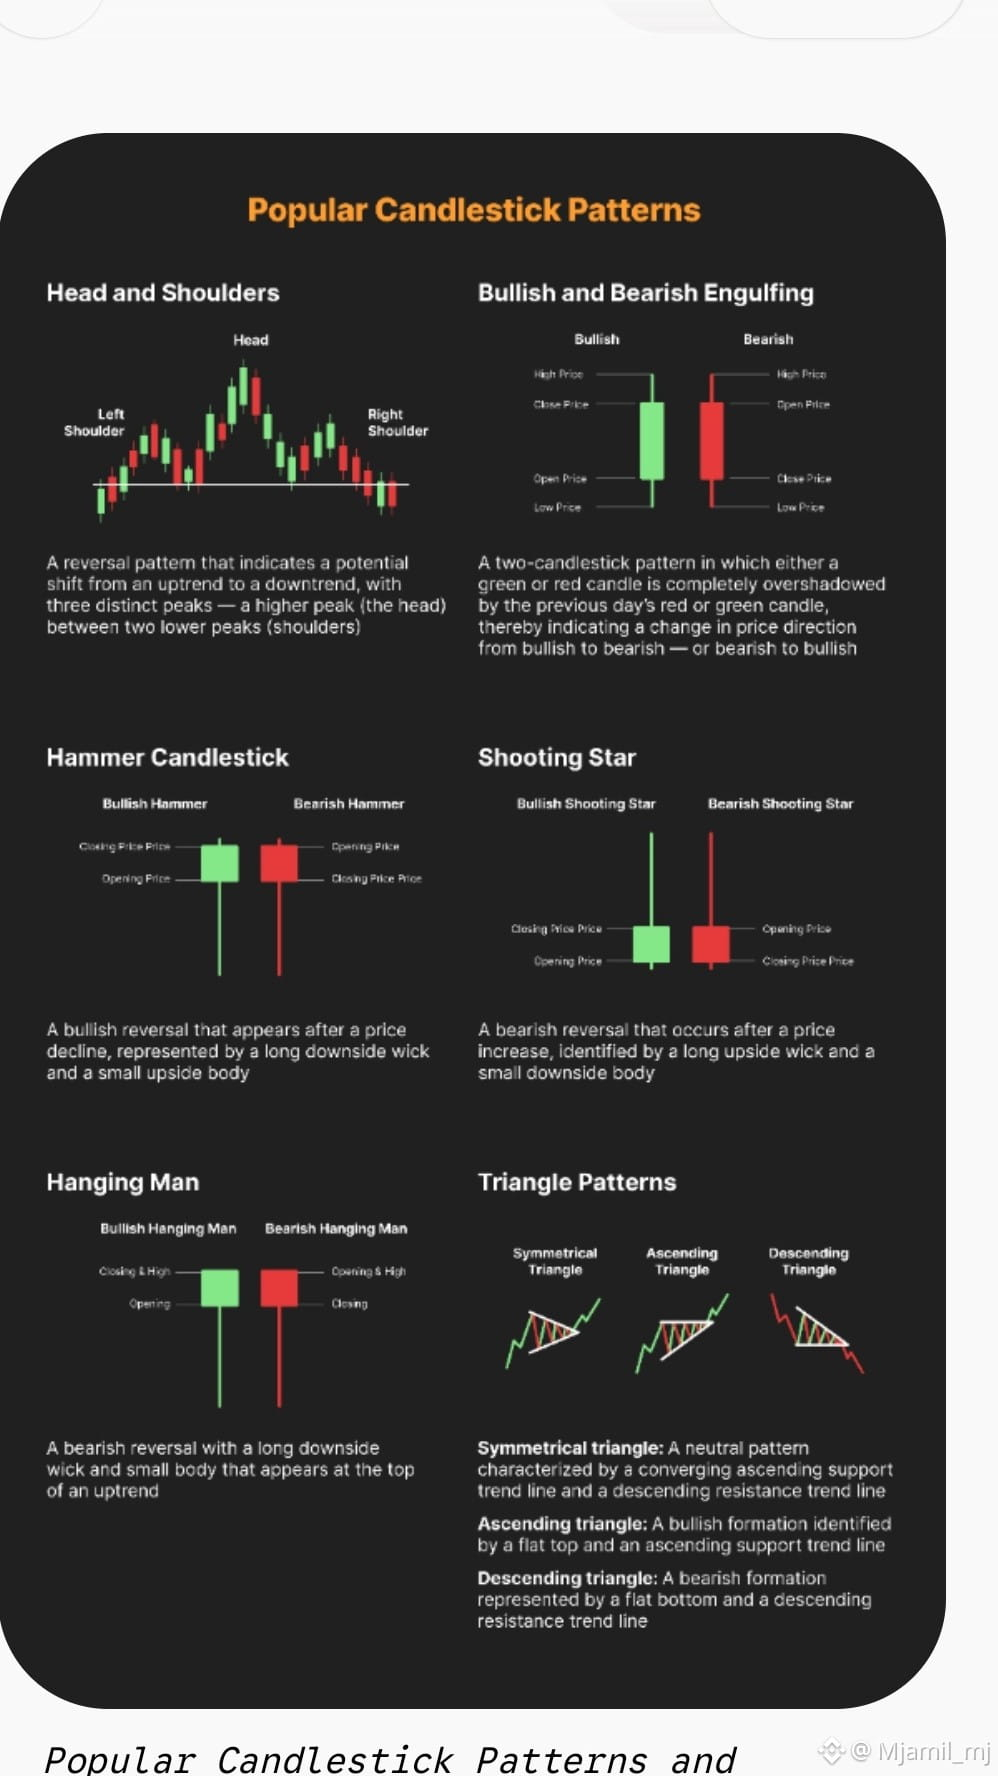
The chart in the image displays a 15-minute (15m) time frame. Every vertical bar or "candlestick" represents price movement over a 15-minute interval and contains four critical data points:
* Open: The price when the 15-minute window started.
* Close: The price when the window ended.
* High: The absolute highest price reached during that period.
* Low: The absolute lowest price reached during that period.
Bullish vs. Bearish Candlesticks:
* Green Candles: Indicate upward momentum (Close > Open). Buyers drove the price up.
* Red Candles: Indicate downward momentum (Open > Close). Sellers pushed the price down.
2. The Math Behind Moving Averages (MA)
Moving Averages smooth out price noise to help traders identify the overall market trend. They use historical mathematical computations over a specific number of periods (N).
A. Simple Moving Average (SMA)
The SMA calculates the unweighted average of previous closing prices over a set number of candles (N).
Where:
* P = Closing price of a given period.
* N = Total number of periods (e.g., 7, 25, or 99).
Application on the Chart:
* $Q
$BTC
*
This article breaks down how to read crypto charts, analyze candlesticks, and apply the mathematical formulas driving core technical indicators like Moving Averages (MA) and Exponential Moving Averages (EMA).
1. Anatomy of a Crypto Candlestick Chart
The chart in the image displays a 15-minute (15m) time frame. Every vertical bar or "candlestick" represents price movement over a 15-minute interval and contains four critical data points:
* Open: The price when the 15-minute window started.
* Close: The price when the window ended.
* High: The absolute highest price reached during that period.
* Low: The absolute lowest price reached during that period.
Bullish vs. Bearish Candlesticks:
* Green Candles: Indicate upward momentum (Close > Open). Buyers drove the price up.
* Red Candles: Indicate downward momentum (Open > Close). Sellers pushed the price down.
2. The Math Behind Moving Averages (MA)
Moving Averages smooth out price noise to help traders identify the overall market trend. They use historical mathematical computations over a specific number of periods (N).
A. Simple Moving Average (SMA)
The SMA calculates the unweighted average of previous closing prices over a set number of candles (N).
Where:
* P = Closing price of a given period.
* N = Total number of periods (e.g., 7, 25, or 99).
Application on the Chart:
* $Q
$BTC
*