🚀 AGTUSDT: Bullish Breakout or the Beginning of a Major Correction?
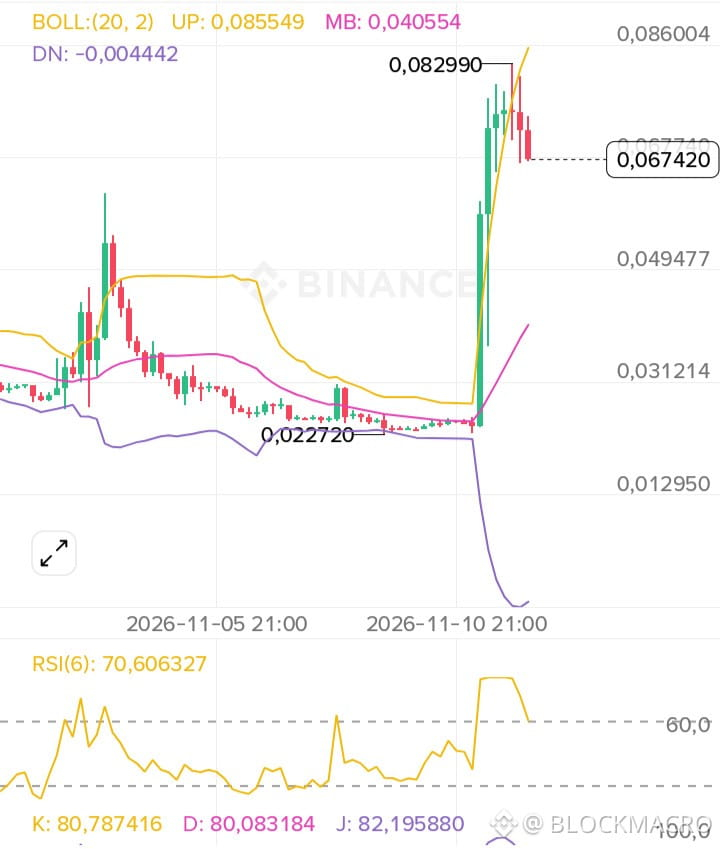
AGT has delivered an explosive rally, climbing from $0.02270 to a recent high of $0.08299. But after such an aggressive move, the market is facing an important decision.
📊 4H Technical Analysis
Current price on the chart: $0.06742
RSI(6): 70.61 – strong momentum, but correction risk remains.
Bollinger Upper Band: $0.08555
Bollinger Middle Band: $0.04055
Recent resistance: $0.07800–$0.08300
🟢 Bullish Scenario – LONG A successful retest of $0.06800–$0.07100, followed by a strong 4H bullish candle, could create an opportunity for another upward move.
Targets:
TP1: $0.07800
TP2: $0.08300
TP3: $0.08550
🔴 Bearish Scenario – SHORT A confirmed 4H breakdown below $0.06500 could signal deeper profit-taking.
Potential targets:
TP1: $0.06000
TP2: $0.05500
TP3: $0.04800
🔥 Fundamental Perspective
AGT is connected to the Alaya AI ecosystem, operating at the intersection of artificial intelligence, blockchain, and decentralized data.
The AI narrative provides potential long-term interest, but token supply dynamics, unlock events, speculative positioning, and market liquidity remain important risks.
My Strategy: I remain cautiously bullish on the broader structure, but I won't chase the rally. I want confirmation of support before considering a LONG position.
⚡ Let's debate:
After a rally of more than 260% from the recent low, is AGT preparing for another leg higher, or are buyers about to get trapped?
Are you LONG or SHORT?
$AGT #AGTUSDT #TradingIdeas
AGT has delivered an explosive rally, climbing from $0.02270 to a recent high of $0.08299. But after such an aggressive move, the market is facing an important decision.
📊 4H Technical Analysis
Current price on the chart: $0.06742
RSI(6): 70.61 – strong momentum, but correction risk remains.
Bollinger Upper Band: $0.08555
Bollinger Middle Band: $0.04055
Recent resistance: $0.07800–$0.08300
🟢 Bullish Scenario – LONG A successful retest of $0.06800–$0.07100, followed by a strong 4H bullish candle, could create an opportunity for another upward move.
Targets:
TP1: $0.07800
TP2: $0.08300
TP3: $0.08550
🔴 Bearish Scenario – SHORT A confirmed 4H breakdown below $0.06500 could signal deeper profit-taking.
Potential targets:
TP1: $0.06000
TP2: $0.05500
TP3: $0.04800
🔥 Fundamental Perspective
AGT is connected to the Alaya AI ecosystem, operating at the intersection of artificial intelligence, blockchain, and decentralized data.
The AI narrative provides potential long-term interest, but token supply dynamics, unlock events, speculative positioning, and market liquidity remain important risks.
My Strategy: I remain cautiously bullish on the broader structure, but I won't chase the rally. I want confirmation of support before considering a LONG position.
⚡ Let's debate:
After a rally of more than 260% from the recent low, is AGT preparing for another leg higher, or are buyers about to get trapped?
Are you LONG or SHORT?
$AGT #AGTUSDT #TradingIdeas