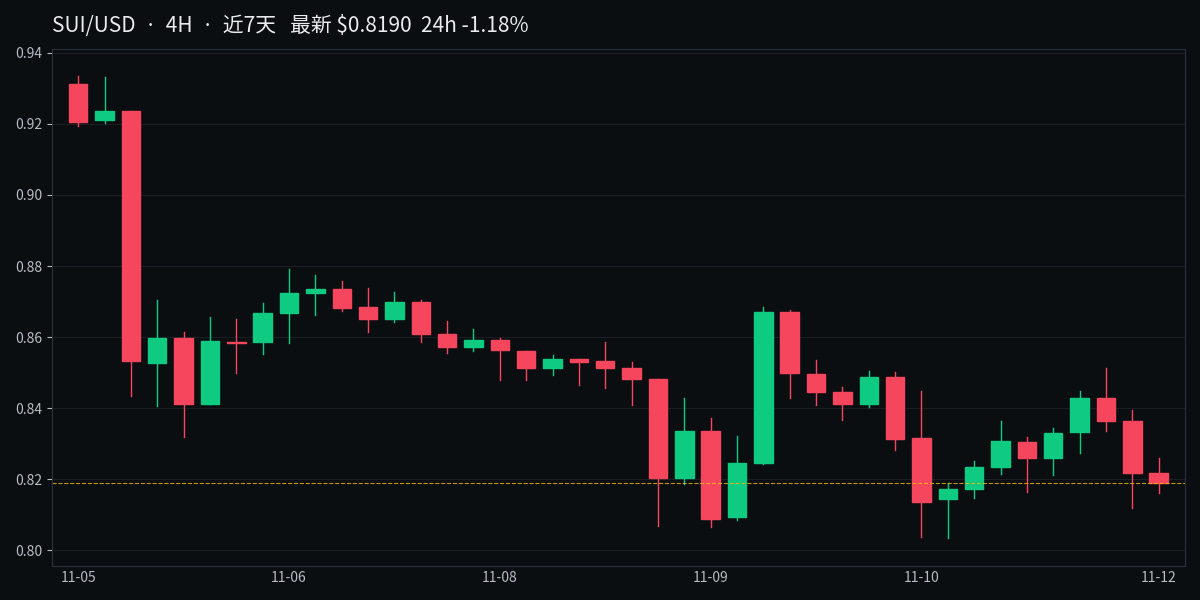
SUI has been moving in a fairly typical pattern over the past few days. Looking at #趋势结构 , each high has been lower than the last: 0.93 → 0.87 → now hovering around 0.81. The lows are also shifting downward, so the downtrend remains intact.
The current price is 0.813. MA7 at 0.83 and MA25 at 0.836 are both overhead, with the price trading below the moving averages throughout. The bearish alignment remains unchanged. RSI at 36.4 is nearing oversold territory. MACD is still below the zero line, but its histogram has just turned slightly positive, suggesting bearish momentum is easing a little.
The lower Bollinger Band at 0.804 is the support just below. The price dipped as low as 0.803 over the past few days; if it can't hold, it may keep moving lower. To the upside, watch the middle band around 0.832 first. A move above that would suggest a recovery, with 0.86 as the next level.
Volume isn't offering much support either. Yesterday's volume was $260 million, down from the 7-day daily average of $310 million. Volume didn't pick up during the drop, so selling pressure isn't especially fierce, but there's no real buying support either.
If it holds above 0.80, watch for a rebound toward 0.83 first. If it breaks below 0.80, the downtrend could continue. $SUI
The current price is 0.813. MA7 at 0.83 and MA25 at 0.836 are both overhead, with the price trading below the moving averages throughout. The bearish alignment remains unchanged. RSI at 36.4 is nearing oversold territory. MACD is still below the zero line, but its histogram has just turned slightly positive, suggesting bearish momentum is easing a little.
The lower Bollinger Band at 0.804 is the support just below. The price dipped as low as 0.803 over the past few days; if it can't hold, it may keep moving lower. To the upside, watch the middle band around 0.832 first. A move above that would suggest a recovery, with 0.86 as the next level.
Volume isn't offering much support either. Yesterday's volume was $260 million, down from the 7-day daily average of $310 million. Volume didn't pick up during the drop, so selling pressure isn't especially fierce, but there's no real buying support either.
If it holds above 0.80, watch for a rebound toward 0.83 first. If it breaks below 0.80, the downtrend could continue. $SUI