$GUA /USDT 15-minute chart update: monitoring sideways movement 📊
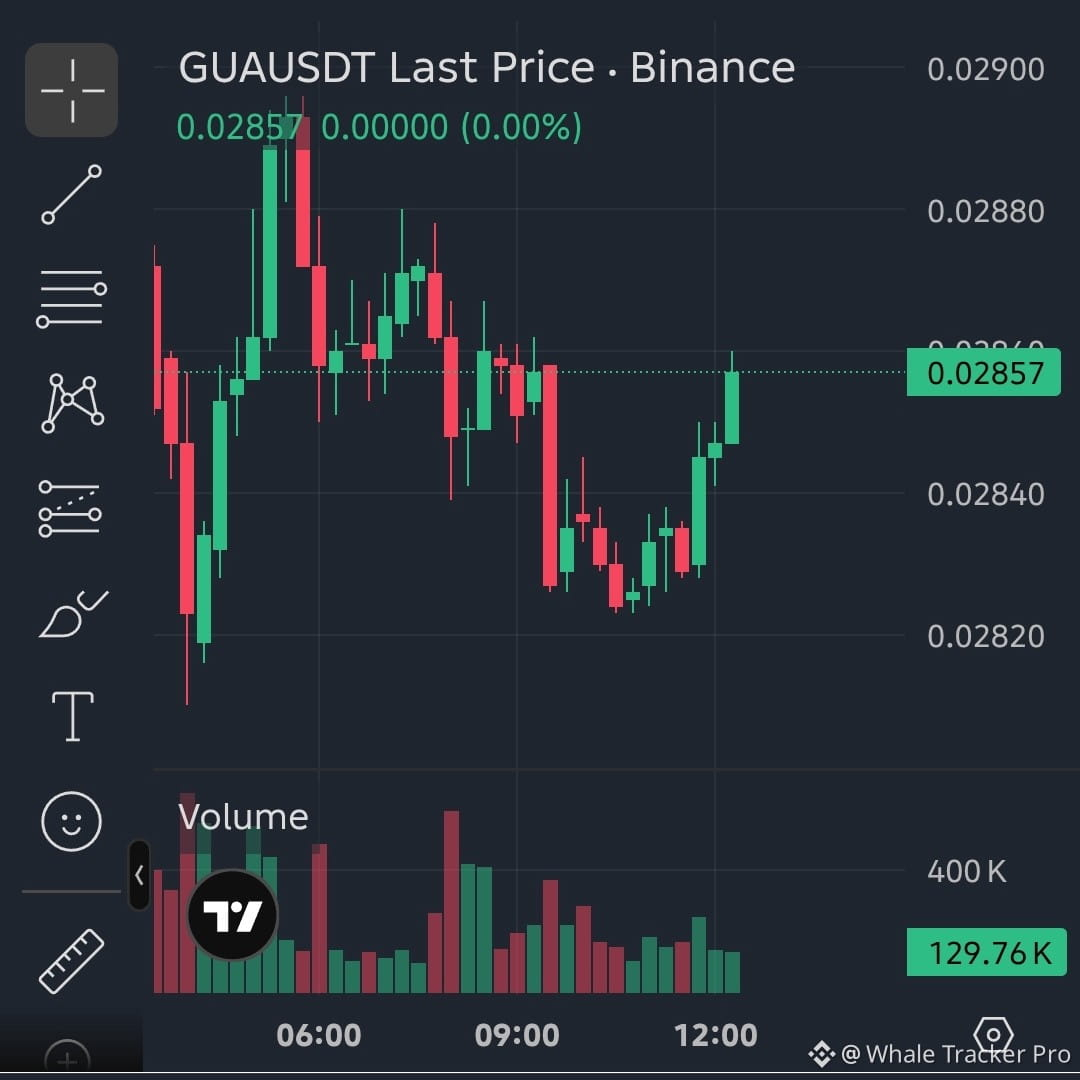
Looking at the 15-minute chart for $GUA on Binance futures, the price is currently trading around 0.02857 after recording a local low near 0.02820 and rebounding with a bullish green candle.
🔍 Technical analysis and price action:
• Market structure: Short-term sideways movement following a slight downward correction, as the price attempts to stabilize after testing the lower boundary of the recent range.
• Liquidity and support: The latest drop toward the 0.02820 area swept local sell-side liquidity and was followed by a responsive bounce. However, overhead supply zones and previous highs near 0.02880–0.02900 remain key levels to monitor.
• Volume and momentum: Volume bars show moderate activity during the recent recovery phase, but continued follow-through needs confirmation before identifying a direction with a high probability of success.
📌 Strategy: Wait / No trade 🛑
Given the range-bound price action and the absence of a clear structural break, forcing a trade here carries unnecessary risk.
What to wait for:
1. Bullish scenario: A strong close above 0.02890 accompanied by increased trading volume to confirm a continued breakout toward 2. Bearish scenario: Rejection at the current resistance or failure to hold the 0.02820 support, which could open the door to a retest of deeper liquidity zones.
Looking at the 15-minute chart for $GUA on Binance futures, the price is currently trading around 0.02857 after recording a local low near 0.02820 and rebounding with a bullish green candle.
🔍 Technical analysis and price action:
• Market structure: Short-term sideways movement following a slight downward correction, as the price attempts to stabilize after testing the lower boundary of the recent range.
• Liquidity and support: The latest drop toward the 0.02820 area swept local sell-side liquidity and was followed by a responsive bounce. However, overhead supply zones and previous highs near 0.02880–0.02900 remain key levels to monitor.
• Volume and momentum: Volume bars show moderate activity during the recent recovery phase, but continued follow-through needs confirmation before identifying a direction with a high probability of success.
📌 Strategy: Wait / No trade 🛑
Given the range-bound price action and the absence of a clear structural break, forcing a trade here carries unnecessary risk.
What to wait for:
1. Bullish scenario: A strong close above 0.02890 accompanied by increased trading volume to confirm a continued breakout toward 2. Bearish scenario: Rejection at the current resistance or failure to hold the 0.02820 support, which could open the door to a retest of deeper liquidity zones.