$KGEN
📊 $KGEN /USDT chart analysis and update for the 15-minute timeframe:
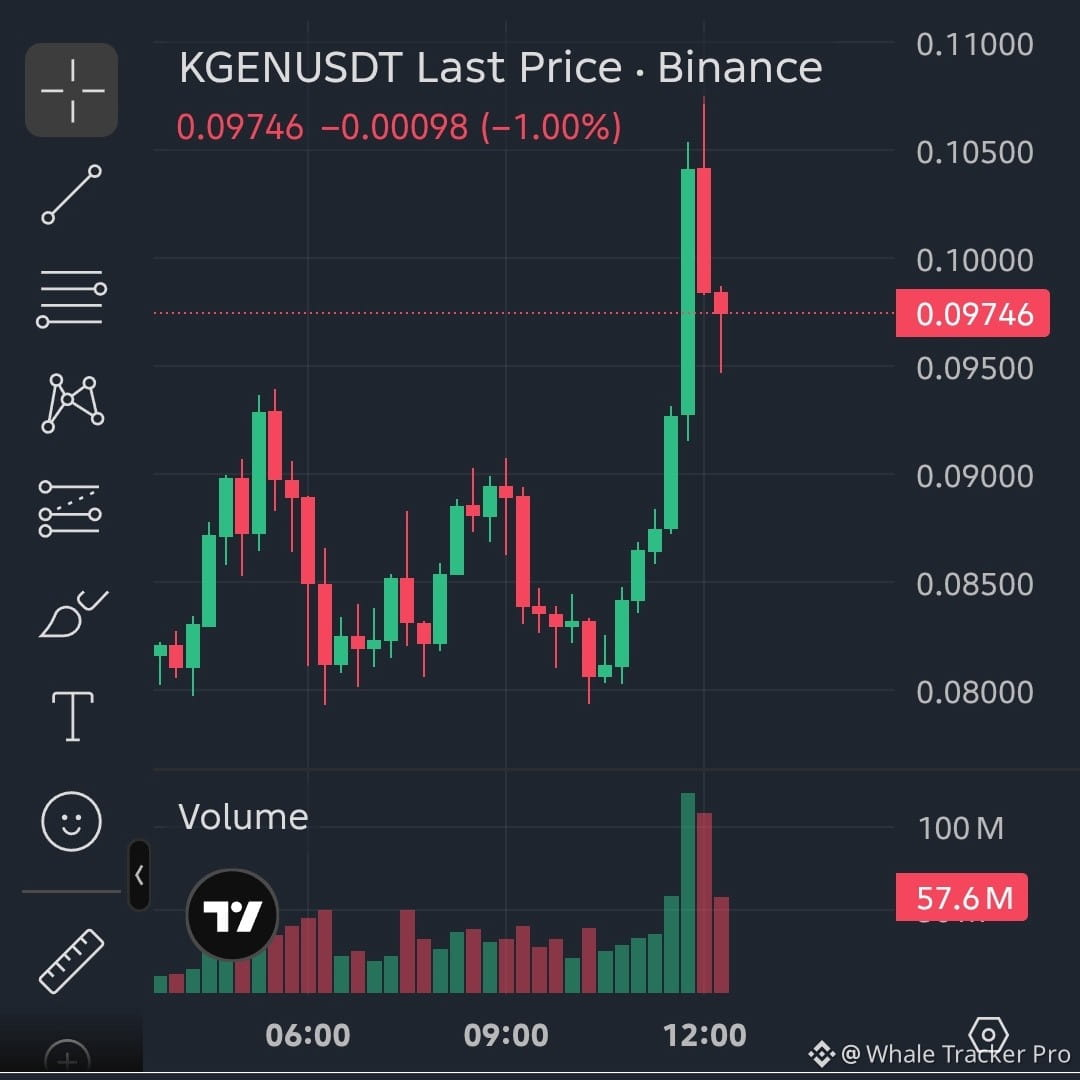
$KGEN is currently trading at 0.09742, posting strong 24-hour gains of +45.73%, with a high of 0.10753 and a low of 0.06630. On the 15-minute timeframe, the price recently made a sharp vertical surge toward the liquidity zone at 0.10750, followed by a swift pullback and a red rejection candle, forming a local correction and consolidation phase.
The order book shows a very balanced distribution, with buyers at 50.73% versus sellers at 49.27%, indicating significant indecision immediately after the massive impulsive rally. Chasing this volatility without a confirmed retest or price base carries high risk.
⚠️ Status: Wait / No trade (WAIT / NO TRADE)
🔍 What to watch:
* Wait for the price to form a clear support base or correct back toward deeper demand zones before looking for new bullish trades.
* Don’t chase long candles at random. Protect your capital with strict risk management!
$KGEN
#BinanceSquare #CryptoAnalysis #KGEN #TradingSetups
📊 $KGEN /USDT chart analysis and update for the 15-minute timeframe:
$KGEN is currently trading at 0.09742, posting strong 24-hour gains of +45.73%, with a high of 0.10753 and a low of 0.06630. On the 15-minute timeframe, the price recently made a sharp vertical surge toward the liquidity zone at 0.10750, followed by a swift pullback and a red rejection candle, forming a local correction and consolidation phase.
The order book shows a very balanced distribution, with buyers at 50.73% versus sellers at 49.27%, indicating significant indecision immediately after the massive impulsive rally. Chasing this volatility without a confirmed retest or price base carries high risk.
⚠️ Status: Wait / No trade (WAIT / NO TRADE)
🔍 What to watch:
* Wait for the price to form a clear support base or correct back toward deeper demand zones before looking for new bullish trades.
* Don’t chase long candles at random. Protect your capital with strict risk management!
$KGEN
#BinanceSquare #CryptoAnalysis #KGEN #TradingSetups