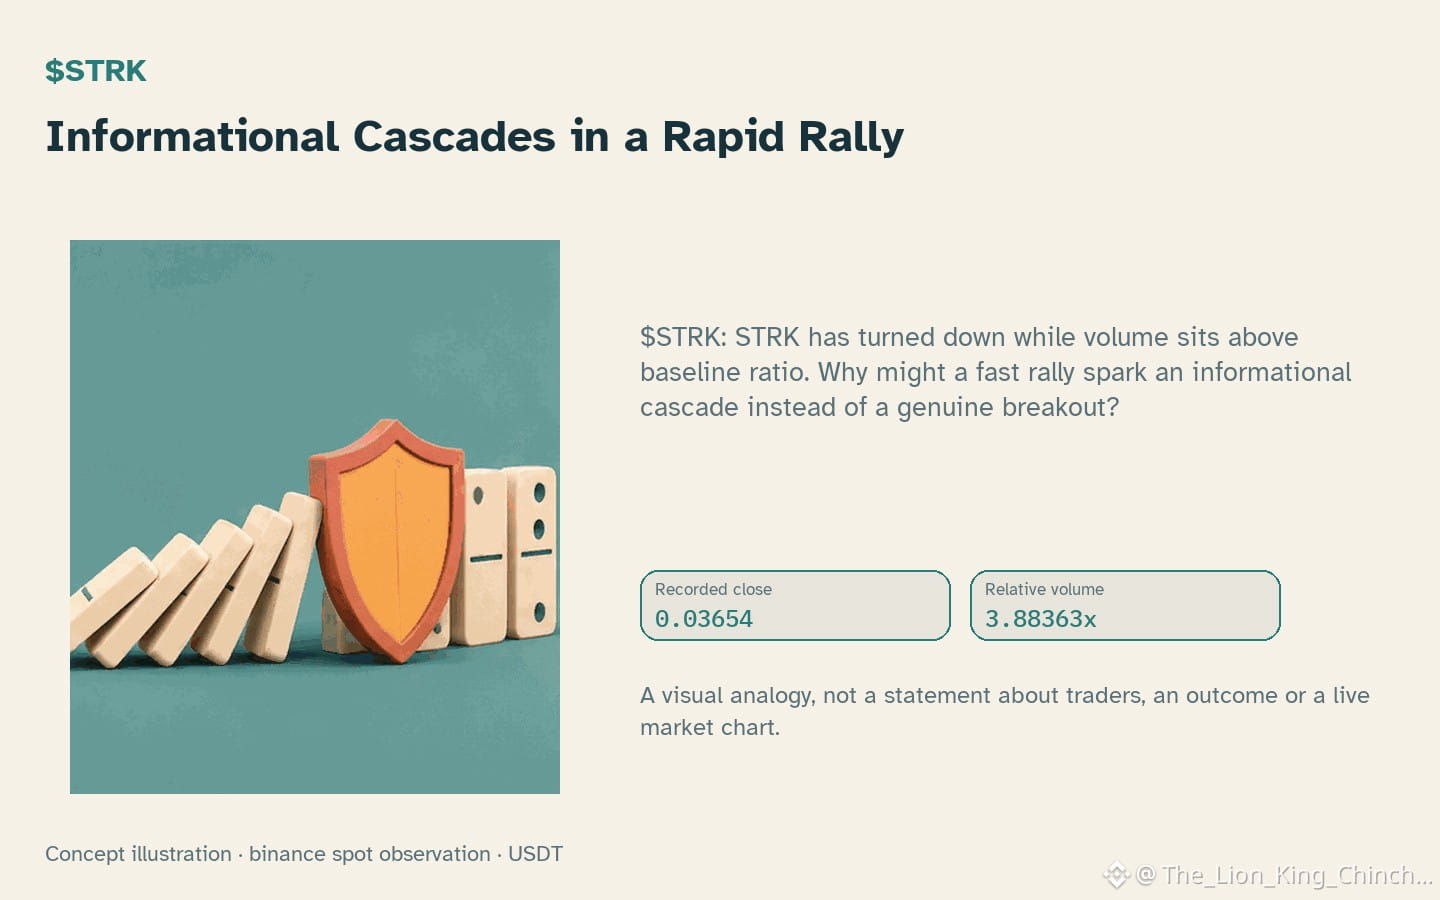
$STRK: Informational Cascades in a Rapid Rally
$STRK: STRK has turned down while volume sits above baseline ratio. Why might a fast rally spark an informational cascade instead of a genuine breakout?
### The tempting shortcut
When traders see hourly direction down but notice relative volume 3.88x baseline, the contrast can create a mental shortcut. The bias of anchoring may cause people to fixate on the volume spike as proof of strength, ignoring the price move. This shortcut often fuels an informational cascade: each participant assumes the previous trader had better information, so they join the rally without independent analysis.
### A more careful interpretation
A cautious view would treat the volume surge as a single data point and ask whether it reflects broader participation or a short‑lived burst. RSI 41.2 offers a modest gauge of momentum, but on its own it cannot confirm a sustained trend. Traders might over‑react, driven by fear of missing out, and push the price higher even though the hourly direction remains down. This scenario illustrates loss aversion: the pain of missing a perceived gain can outweigh the risk of a reversal.
### A useful next observation
Future closed‑candle data that shows hourly change -0.191205% turning positive would weaken the cascade hypothesis, suggesting genuine buying pressure. Conversely, a return to neutral or negative change would support the idea that the rally was mainly psychological.
**Self‑check**: Before adding to a position, ask if you are following the volume cue because you independently see value, or because you are echoing the crowd. If the answer leans toward the latter, pause and wait for a confirming price move.
Probabilistic market research, not a recommendation or guaranteed return.
Watchlist contrast: $ETH has hourly direction up and volume not above its baseline; $KITE has hourly direction up and volume above its baseline. This alone does not establish correlation.
#STRK #ETH #KITE #TradingPsychology
$STRK: STRK has turned down while volume sits above baseline ratio. Why might a fast rally spark an informational cascade instead of a genuine breakout?
### The tempting shortcut
When traders see hourly direction down but notice relative volume 3.88x baseline, the contrast can create a mental shortcut. The bias of anchoring may cause people to fixate on the volume spike as proof of strength, ignoring the price move. This shortcut often fuels an informational cascade: each participant assumes the previous trader had better information, so they join the rally without independent analysis.
### A more careful interpretation
A cautious view would treat the volume surge as a single data point and ask whether it reflects broader participation or a short‑lived burst. RSI 41.2 offers a modest gauge of momentum, but on its own it cannot confirm a sustained trend. Traders might over‑react, driven by fear of missing out, and push the price higher even though the hourly direction remains down. This scenario illustrates loss aversion: the pain of missing a perceived gain can outweigh the risk of a reversal.
### A useful next observation
Future closed‑candle data that shows hourly change -0.191205% turning positive would weaken the cascade hypothesis, suggesting genuine buying pressure. Conversely, a return to neutral or negative change would support the idea that the rally was mainly psychological.
**Self‑check**: Before adding to a position, ask if you are following the volume cue because you independently see value, or because you are echoing the crowd. If the answer leans toward the latter, pause and wait for a confirming price move.
Probabilistic market research, not a recommendation or guaranteed return.
Watchlist contrast: $ETH has hourly direction up and volume not above its baseline; $KITE has hourly direction up and volume above its baseline. This alone does not establish correlation.
#STRK #ETH #KITE #TradingPsychology