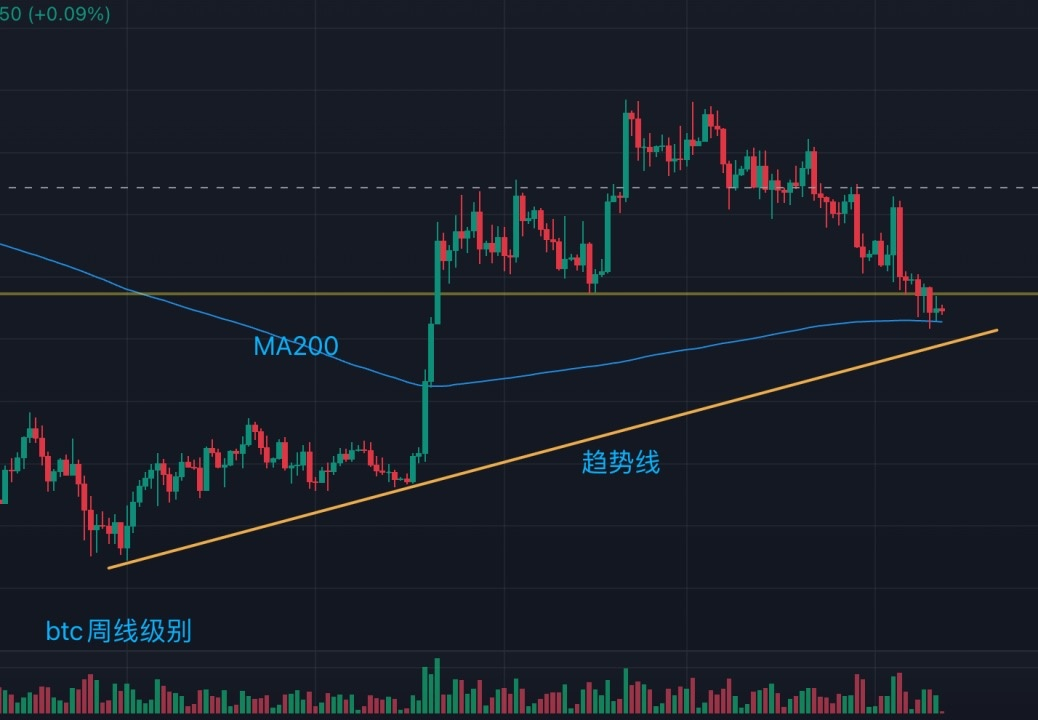
$BTC From the BTC weekly chart, the price has now pulled back to the orange ascending trendline and the blue MA200.
Next, focus on two scenarios:
First, if the price briefly falls below the trendline or MA200, then quickly recovers and the weekly candle closes back above both, forming a false breakdown, this suggests there is some support below, and a potential rebound after finding a bottom may be worth watching. Second, if a weekly candle closes decisively below the trendline and the rebound fails to reclaim it, the existing uptrend structure may be broken, so be alert to a deeper correction.
There is no need to rush to call a bottom at this point. The key is to watch whether the trendline and MA200 hold. A breakdown points to continuation; a breakdown followed by a recovery points to a reversal. The weekly close is what matters.#BTC走势分析
Next, focus on two scenarios:
First, if the price briefly falls below the trendline or MA200, then quickly recovers and the weekly candle closes back above both, forming a false breakdown, this suggests there is some support below, and a potential rebound after finding a bottom may be worth watching. Second, if a weekly candle closes decisively below the trendline and the rebound fails to reclaim it, the existing uptrend structure may be broken, so be alert to a deeper correction.
There is no need to rush to call a bottom at this point. The key is to watch whether the trendline and MA200 hold. A breakdown points to continuation; a breakdown followed by a recovery points to a reversal. The weekly close is what matters.#BTC走势分析