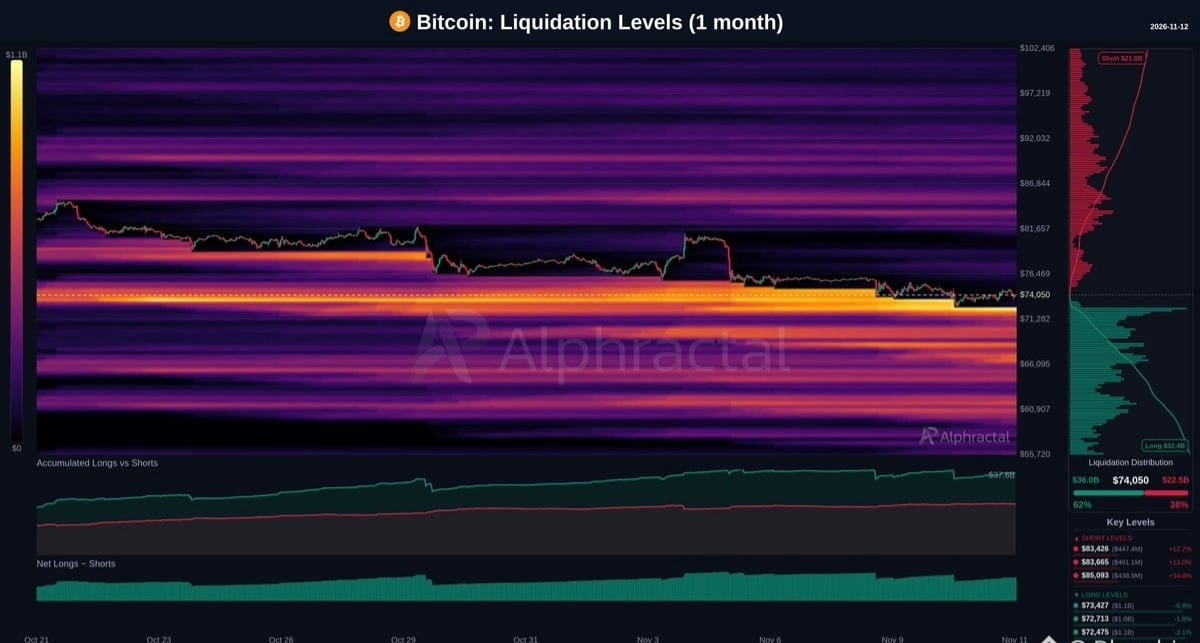
$BTC is right above a large wall of long liquidations.
Liquidation levels show that the market is clearly heavily skewed toward long positions:
🟢 Long positions at risk: $36.0B (62%)
🔴 Short positions at risk: $22.5B (38%)
The densest clusters are just below the price ($74,050):
• $73,427, around $1.1B (−0.8%)
• $72,713, around $1.0B (−1.8%)
• $72,475, around $1.1B (−2.1%)
On the other side, the first significant short clusters only appear around $83.4K–$85.1K, 12–15% away.
When so much leverage builds up so close to the price, liquidity is usually hunted first. A clear break below $72.5K could trigger a cascade of long liquidations worth more than $1B.
That said, liquidation maps show where the fuel is, not where the price has to go.
Liquidation levels show that the market is clearly heavily skewed toward long positions:
🟢 Long positions at risk: $36.0B (62%)
🔴 Short positions at risk: $22.5B (38%)
The densest clusters are just below the price ($74,050):
• $73,427, around $1.1B (−0.8%)
• $72,713, around $1.0B (−1.8%)
• $72,475, around $1.1B (−2.1%)
On the other side, the first significant short clusters only appear around $83.4K–$85.1K, 12–15% away.
When so much leverage builds up so close to the price, liquidity is usually hunted first. A clear break below $72.5K could trigger a cascade of long liquidations worth more than $1B.
That said, liquidation maps show where the fuel is, not where the price has to go.