$RLUSD: Value Context in Low Price Assets
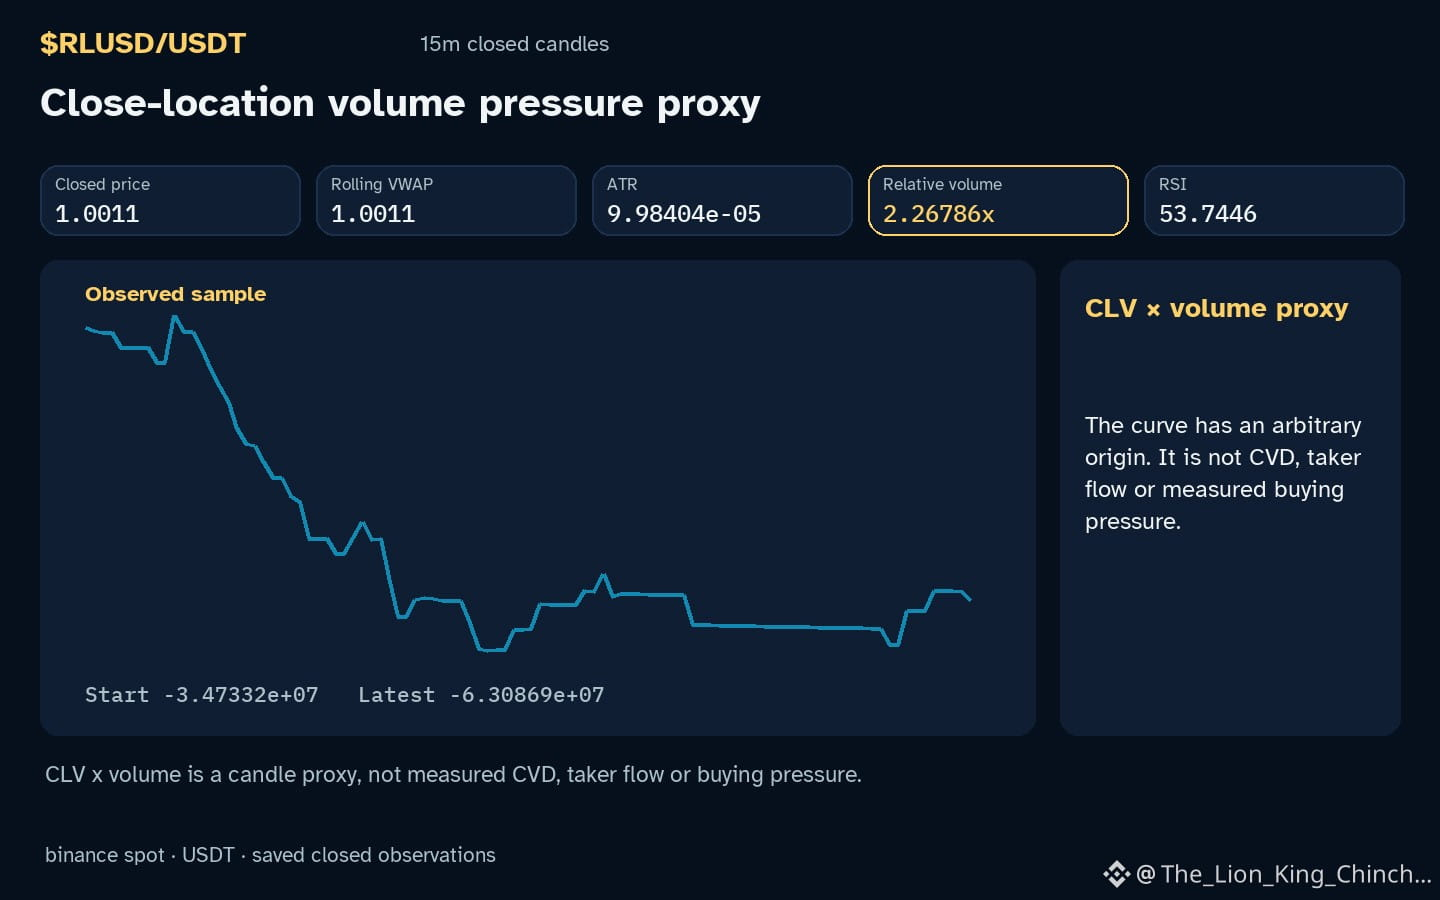
Does $RLUSD value change if participation scales? The asset trades down hourly with relative volume 2.27x baseline. RSI is 53.7. Consider a hypothetical asset priced at 1.0011 and another at fifty thousand dollars. A fixed dollar entry cost affects the number of units acquired per dollar of capital. This mechanical ratio is a static calculation, not a market signal. It ignores liquidity depth and spread costs which are not provided here. Contrast this with capital limits where a fixed budget restricts the ability to diversify across many different assets. In our supplied data, $RLUSD moves down while peers BTC and SNXXB also show down hourly direction. However, volume baselines differ. SNXXB volume is above baseline but BTC is not. These shared directional observations do not prove capital rotation or correlated investor behavior. A counterexample is two assets dropping due entirely to separate local news events. They share direction but have no common cause. Because we lack data on order books or trader motives we cannot link these moves. The evidence supports only that price levels influence the unit-per-dollar ratio. To reassess this interpretation, check if future hourly closes show volume normalization alongside price stability. If volume remains elevated despite sideways price, the participation theory weakens. This confirms that relative volume and price level are distinct factors. Do not assume a larger price tag implies higher quality participation. The mechanism is arithmetic, not behavioral. Future closed candles should test if this link persists.
Probabilistic market research, not a recommendation or guaranteed return.
A useful cross-check: $BTC has hourly direction down and volume not above its baseline; $SNXXB has hourly direction down and volume above its baseline. This alone does not establish correlation.
#RLUSD #BTC
Does $RLUSD value change if participation scales? The asset trades down hourly with relative volume 2.27x baseline. RSI is 53.7. Consider a hypothetical asset priced at 1.0011 and another at fifty thousand dollars. A fixed dollar entry cost affects the number of units acquired per dollar of capital. This mechanical ratio is a static calculation, not a market signal. It ignores liquidity depth and spread costs which are not provided here. Contrast this with capital limits where a fixed budget restricts the ability to diversify across many different assets. In our supplied data, $RLUSD moves down while peers BTC and SNXXB also show down hourly direction. However, volume baselines differ. SNXXB volume is above baseline but BTC is not. These shared directional observations do not prove capital rotation or correlated investor behavior. A counterexample is two assets dropping due entirely to separate local news events. They share direction but have no common cause. Because we lack data on order books or trader motives we cannot link these moves. The evidence supports only that price levels influence the unit-per-dollar ratio. To reassess this interpretation, check if future hourly closes show volume normalization alongside price stability. If volume remains elevated despite sideways price, the participation theory weakens. This confirms that relative volume and price level are distinct factors. Do not assume a larger price tag implies higher quality participation. The mechanism is arithmetic, not behavioral. Future closed candles should test if this link persists.
Probabilistic market research, not a recommendation or guaranteed return.
A useful cross-check: $BTC has hourly direction down and volume not above its baseline; $SNXXB has hourly direction down and volume above its baseline. This alone does not establish correlation.
#RLUSD #BTC