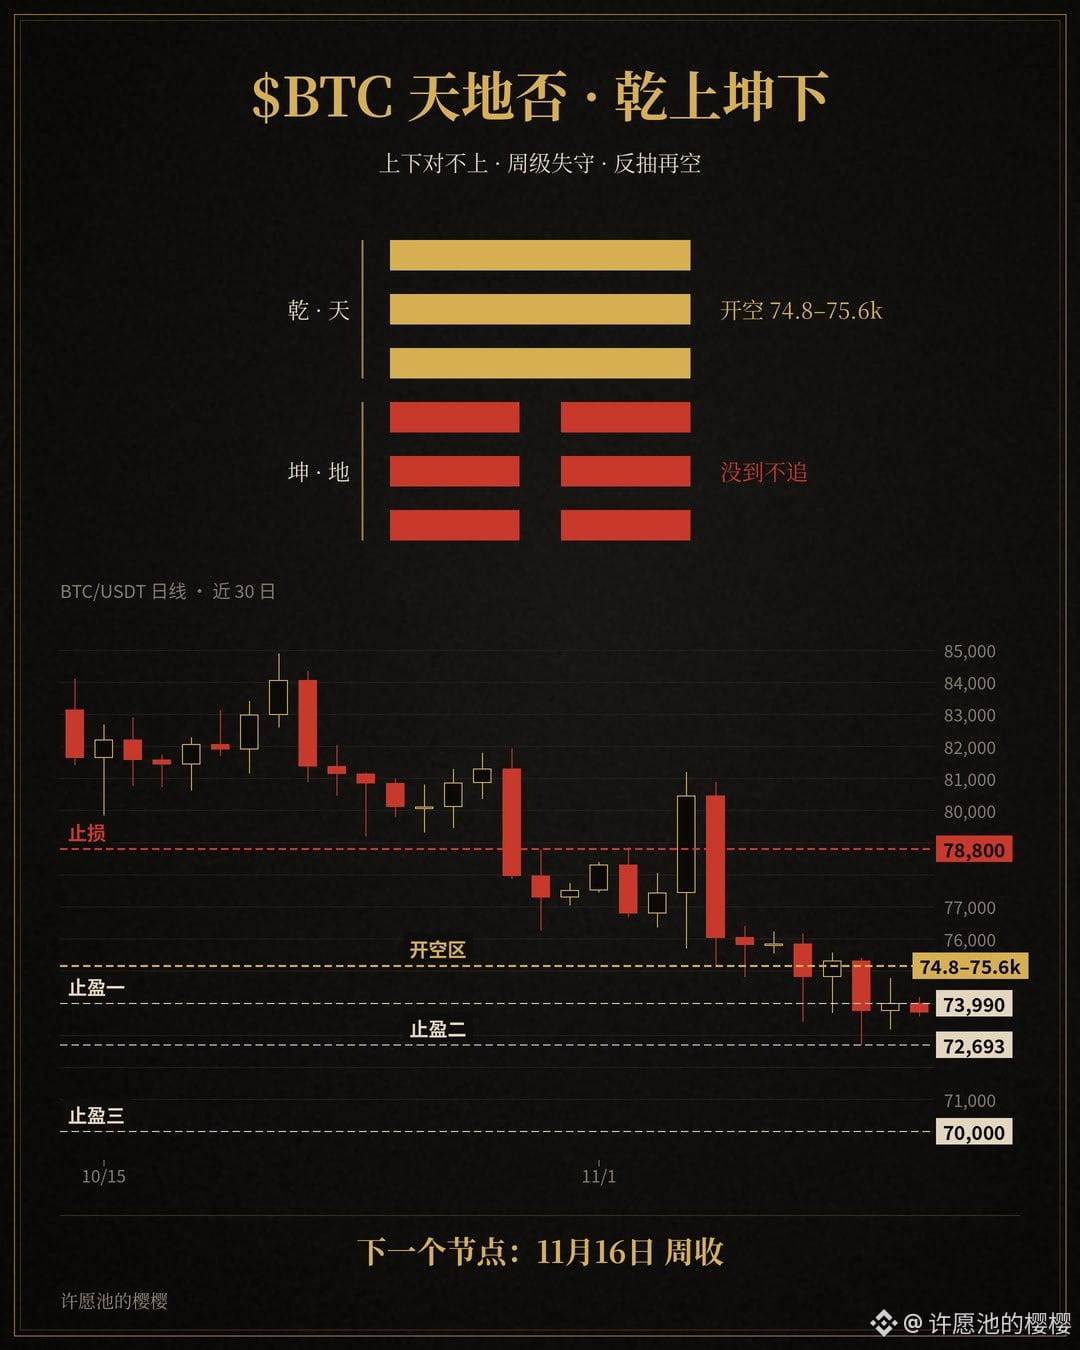
$BTC The I Ching hexagram Pi (Stagnation): Heaven above, Earth below. Heaven is up top, Earth is down below, each going its own way—the plain-English meaning of Pi is that the top and bottom are out of sync. Don’t mistake this stretch of countertrend bounce for a full reversal. Yesterday morning I placed my short entries at 75.4–76.2k; the high yesterday only reached 74,772, so it didn’t touch any of the three levels. This morning, the daily candle opened at 73,990 and only reached a high of 74,185; it has now fallen back to around 73,670. The weak bounce is still in play, and the bearish framework remains intact.
U.S. spot BTC ETFs: Full figures for November 10 (Tuesday) show net outflows of about $95 million (IBIT about −$78.2 million, FBTC about −$36.8 million, MSBT about +$20 million; unofficial/third-party figures, based on Farside). Compared with Monday’s full figure of −$201 million, outflows are narrowing, but the direction hasn’t changed. This is now four consecutive trading days of net outflows. The full November total through Tuesday is about −$1.578 billion. Most of the November 11 (Wednesday) breakdown is not yet available, so I won’t treat incomplete figures as a new conclusion.
U.S. stocks closed reasonably well last night, and volatility came down, but Bitcoin didn’t follow through with strength this morning. I’m leaning toward waiting for a bounce to 74,772–75,563 and then shorting in stages; I won’t chase a short at the current price or below 72,693. The weekly bearish framework is confirmed, and I’m treating the bounce as a selling zone.
Entry: 74,772 / 75,398 / 75,563 (scale in at these levels; no touch, no trade)
Stop loss: 78,800 (with extra room beyond the weekly EMA50)
Take profit 1: 73,990
Take profit 2: 72,693
Take profit 3: 70,000
At the first take-profit level, close half the position and move the stop loss to breakeven. If the daily candle closes above 78,800, the plan is invalidated. The next key point to watch is the weekly close on November 16.
With the top and bottom out of sync, do you think Bitcoin will first bounce back to 74,772–75,563 and give you a short entry, or probe 72,693 again first?
Follow me—I’ll keep you updated as things unfold. Personal opinion, not investment advice.
U.S. spot BTC ETFs: Full figures for November 10 (Tuesday) show net outflows of about $95 million (IBIT about −$78.2 million, FBTC about −$36.8 million, MSBT about +$20 million; unofficial/third-party figures, based on Farside). Compared with Monday’s full figure of −$201 million, outflows are narrowing, but the direction hasn’t changed. This is now four consecutive trading days of net outflows. The full November total through Tuesday is about −$1.578 billion. Most of the November 11 (Wednesday) breakdown is not yet available, so I won’t treat incomplete figures as a new conclusion.
U.S. stocks closed reasonably well last night, and volatility came down, but Bitcoin didn’t follow through with strength this morning. I’m leaning toward waiting for a bounce to 74,772–75,563 and then shorting in stages; I won’t chase a short at the current price or below 72,693. The weekly bearish framework is confirmed, and I’m treating the bounce as a selling zone.
Entry: 74,772 / 75,398 / 75,563 (scale in at these levels; no touch, no trade)
Stop loss: 78,800 (with extra room beyond the weekly EMA50)
Take profit 1: 73,990
Take profit 2: 72,693
Take profit 3: 70,000
At the first take-profit level, close half the position and move the stop loss to breakeven. If the daily candle closes above 78,800, the plan is invalidated. The next key point to watch is the weekly close on November 16.
With the top and bottom out of sync, do you think Bitcoin will first bounce back to 74,772–75,563 and give you a short entry, or probe 72,693 again first?
Follow me—I’ll keep you updated as things unfold. Personal opinion, not investment advice.