ANALYSIS $AGT (1H): Liquidity Sweep at Highs and Return to the Mean! 📉🔥
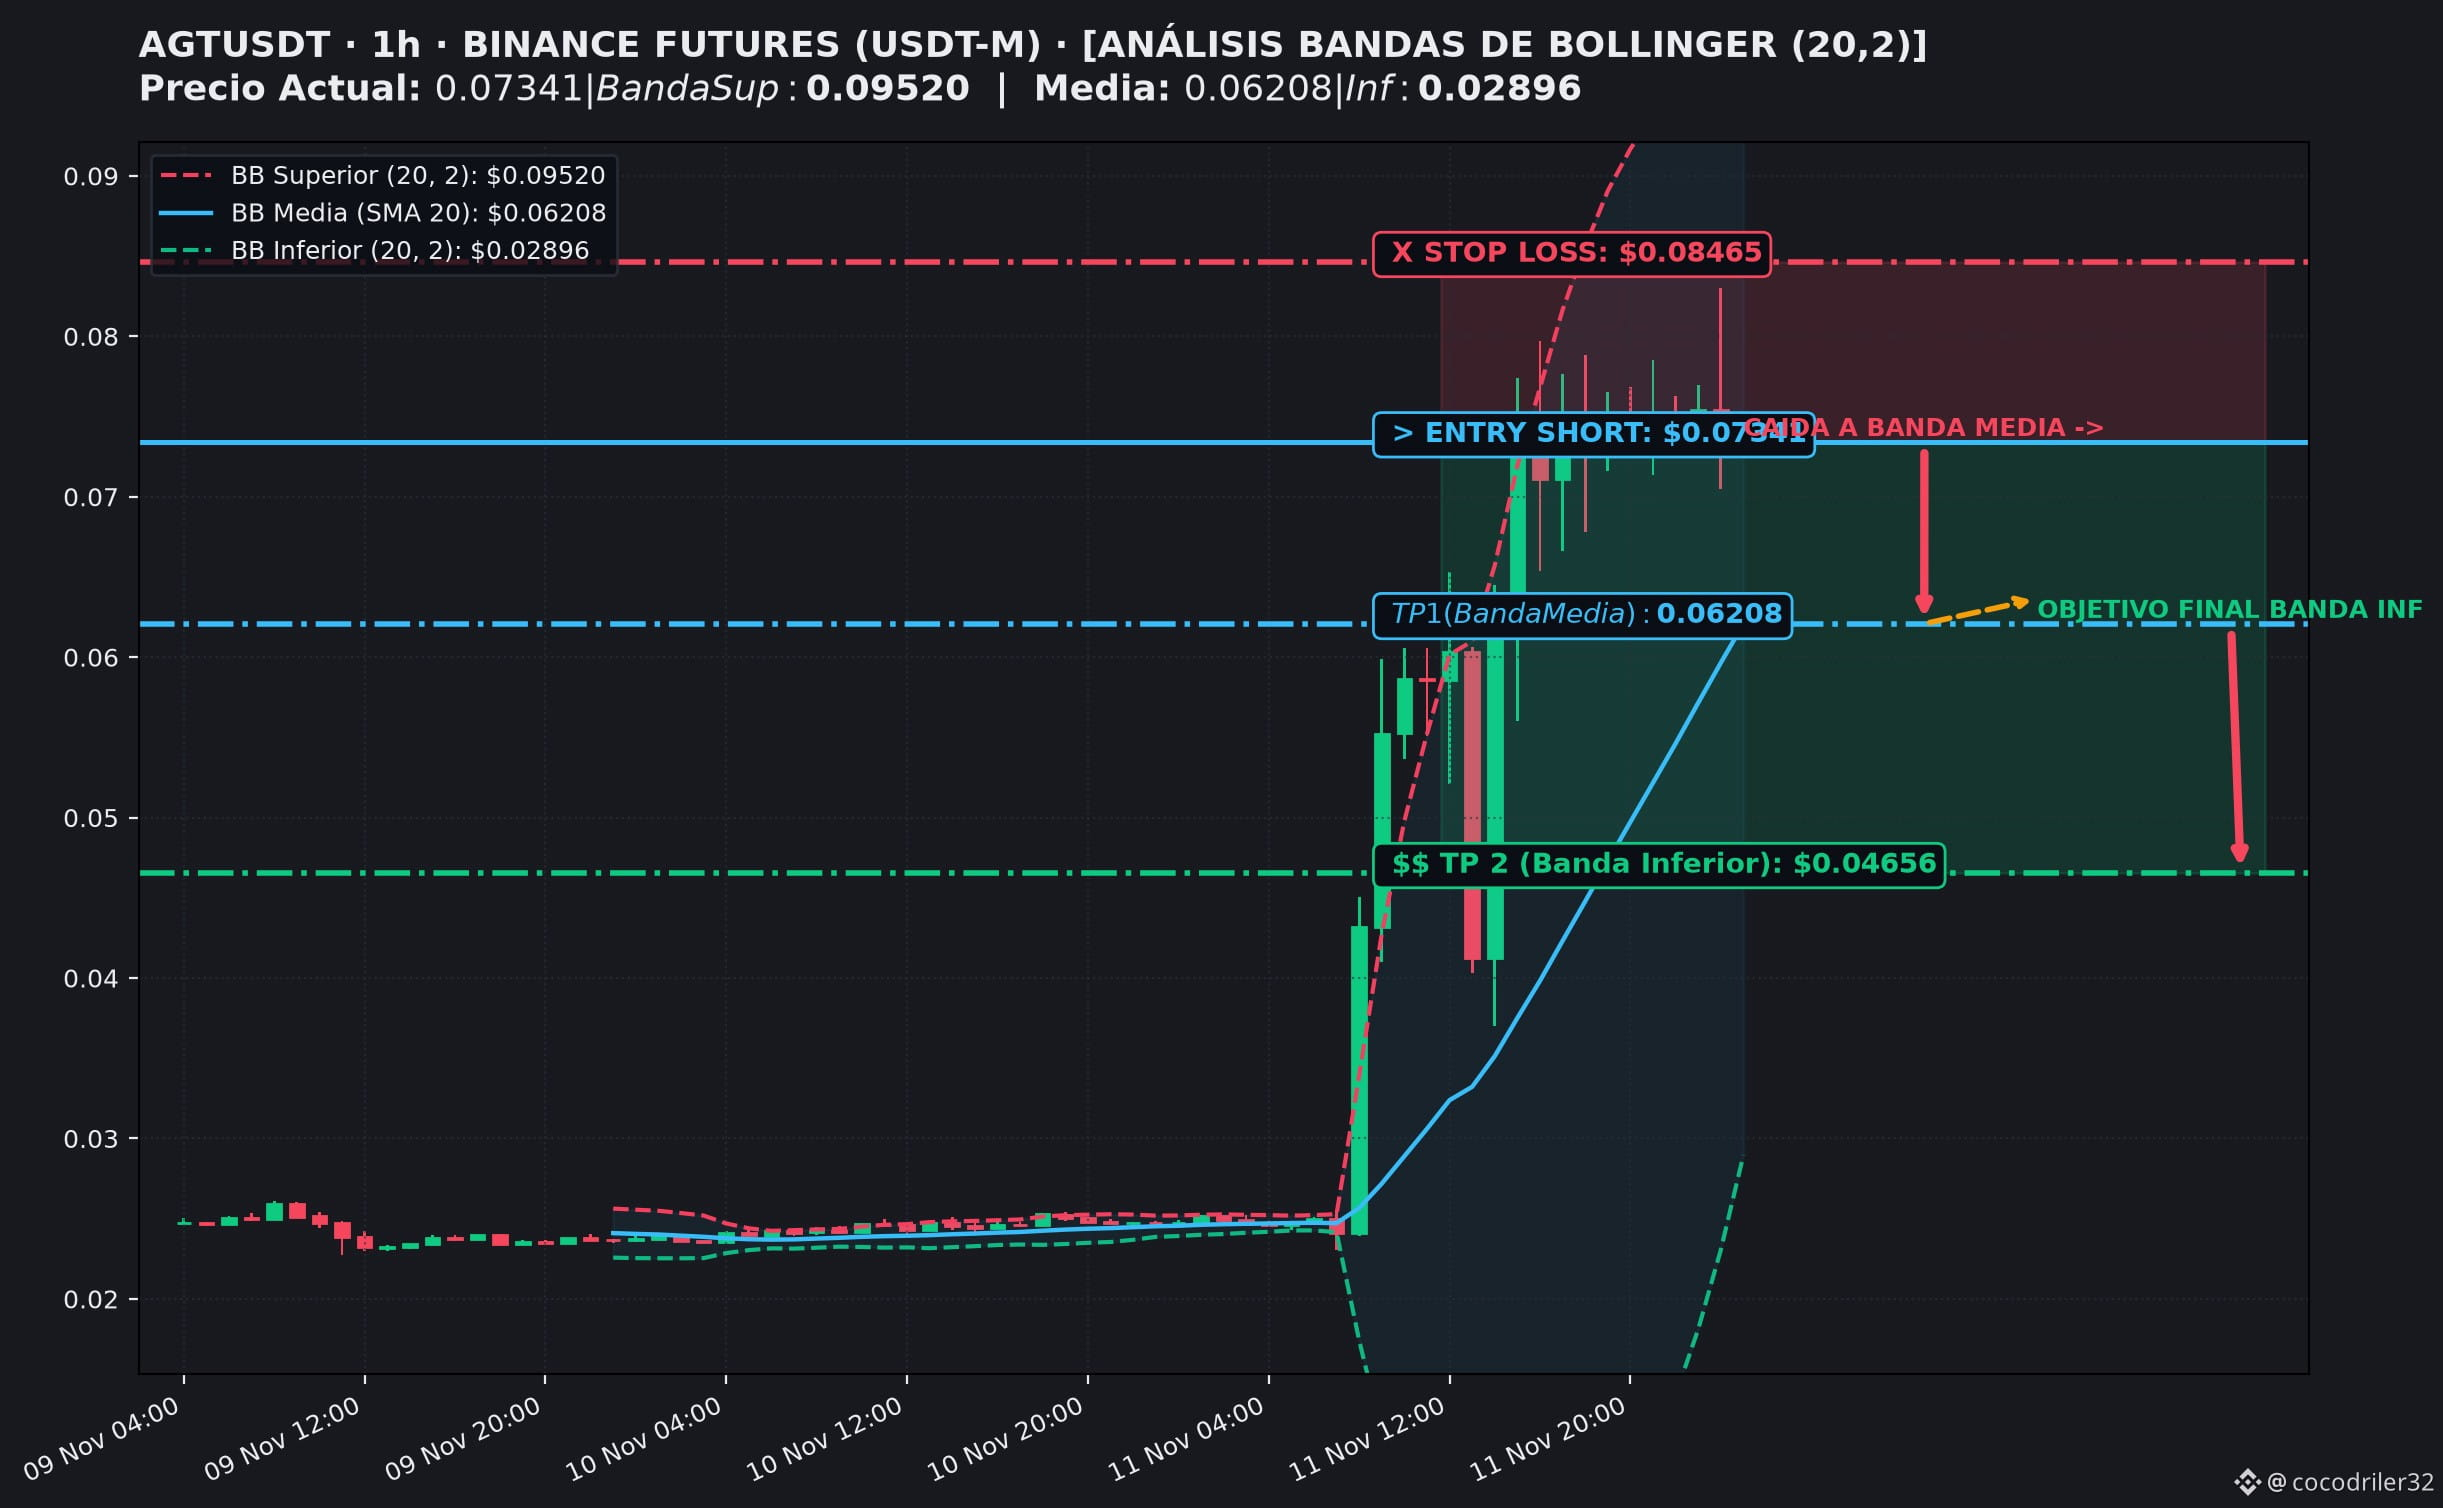
After an explosive rally from 0.0230 to a peak of 0.08299 USDT, the AGTUSDT pair left a strong rejection wick in the last hour (liquidity sweep), losing bullish momentum far from its Bollinger Middle Band.
📌 Key Setup Points (Short / Bollinger Bands):
🎯 Entry Point: 0.07341 USDT (current zone after rejection from the highs)
🛑 Stop Loss: 0.08465 USDT (strict, above the 0.08299 liquidity wick)
💰 Target 1 (TP1): 0.06208 USDT (natural return to the Middle Band / SMA 20)
🚀 Target 2 (TP2): 0.04656 USDT (extension toward the previous consolidation zone)
⚖️ R:R Ratio: 1:1.01 at TP1 | 1:2.39 at TP2
🧠 Technical Rationale Using Bollinger Bands:
- Institutional rejection wick: The attempt to break toward 0.083 USDT was quickly absorbed by selling, with the price closing below the open.
- Volatility overextension: The price ended up too far from the SMA 20 (0.06208 USDT), increasing the likelihood of a correction toward the Middle Band.
- Risk Management: Since this is a highly volatile asset, use low leverage and move the Stop to breakeven when TP1 is reached.
👉 Do you find these price action and Bollinger Bands analyses useful? Follow us for daily alerts and setups!
👇 Do you think AGT will find support at the 0.062 USDT average, or attempt another rally? Comment below!
#BinanceSquare #CryptoTrading #BollingerBands #Futures $BTC $AGT
After an explosive rally from 0.0230 to a peak of 0.08299 USDT, the AGTUSDT pair left a strong rejection wick in the last hour (liquidity sweep), losing bullish momentum far from its Bollinger Middle Band.
📌 Key Setup Points (Short / Bollinger Bands):
🎯 Entry Point: 0.07341 USDT (current zone after rejection from the highs)
🛑 Stop Loss: 0.08465 USDT (strict, above the 0.08299 liquidity wick)
💰 Target 1 (TP1): 0.06208 USDT (natural return to the Middle Band / SMA 20)
🚀 Target 2 (TP2): 0.04656 USDT (extension toward the previous consolidation zone)
⚖️ R:R Ratio: 1:1.01 at TP1 | 1:2.39 at TP2
🧠 Technical Rationale Using Bollinger Bands:
- Institutional rejection wick: The attempt to break toward 0.083 USDT was quickly absorbed by selling, with the price closing below the open.
- Volatility overextension: The price ended up too far from the SMA 20 (0.06208 USDT), increasing the likelihood of a correction toward the Middle Band.
- Risk Management: Since this is a highly volatile asset, use low leverage and move the Stop to breakeven when TP1 is reached.
👉 Do you find these price action and Bollinger Bands analyses useful? Follow us for daily alerts and setups!
👇 Do you think AGT will find support at the 0.062 USDT average, or attempt another rally? Comment below!
#BinanceSquare #CryptoTrading #BollingerBands #Futures $BTC $AGT