🚀 ZK/USDT: Recovery Underway and Short-Term Reversal Signals!
Hey, Binance Square traders! Let’s take a look at the ZK/USDT pair, which has been drawing attention with its latest moves on the 4h and 15m timeframes.
📊 Technical Analysis
4-Hour Chart (Trend and Pivot):
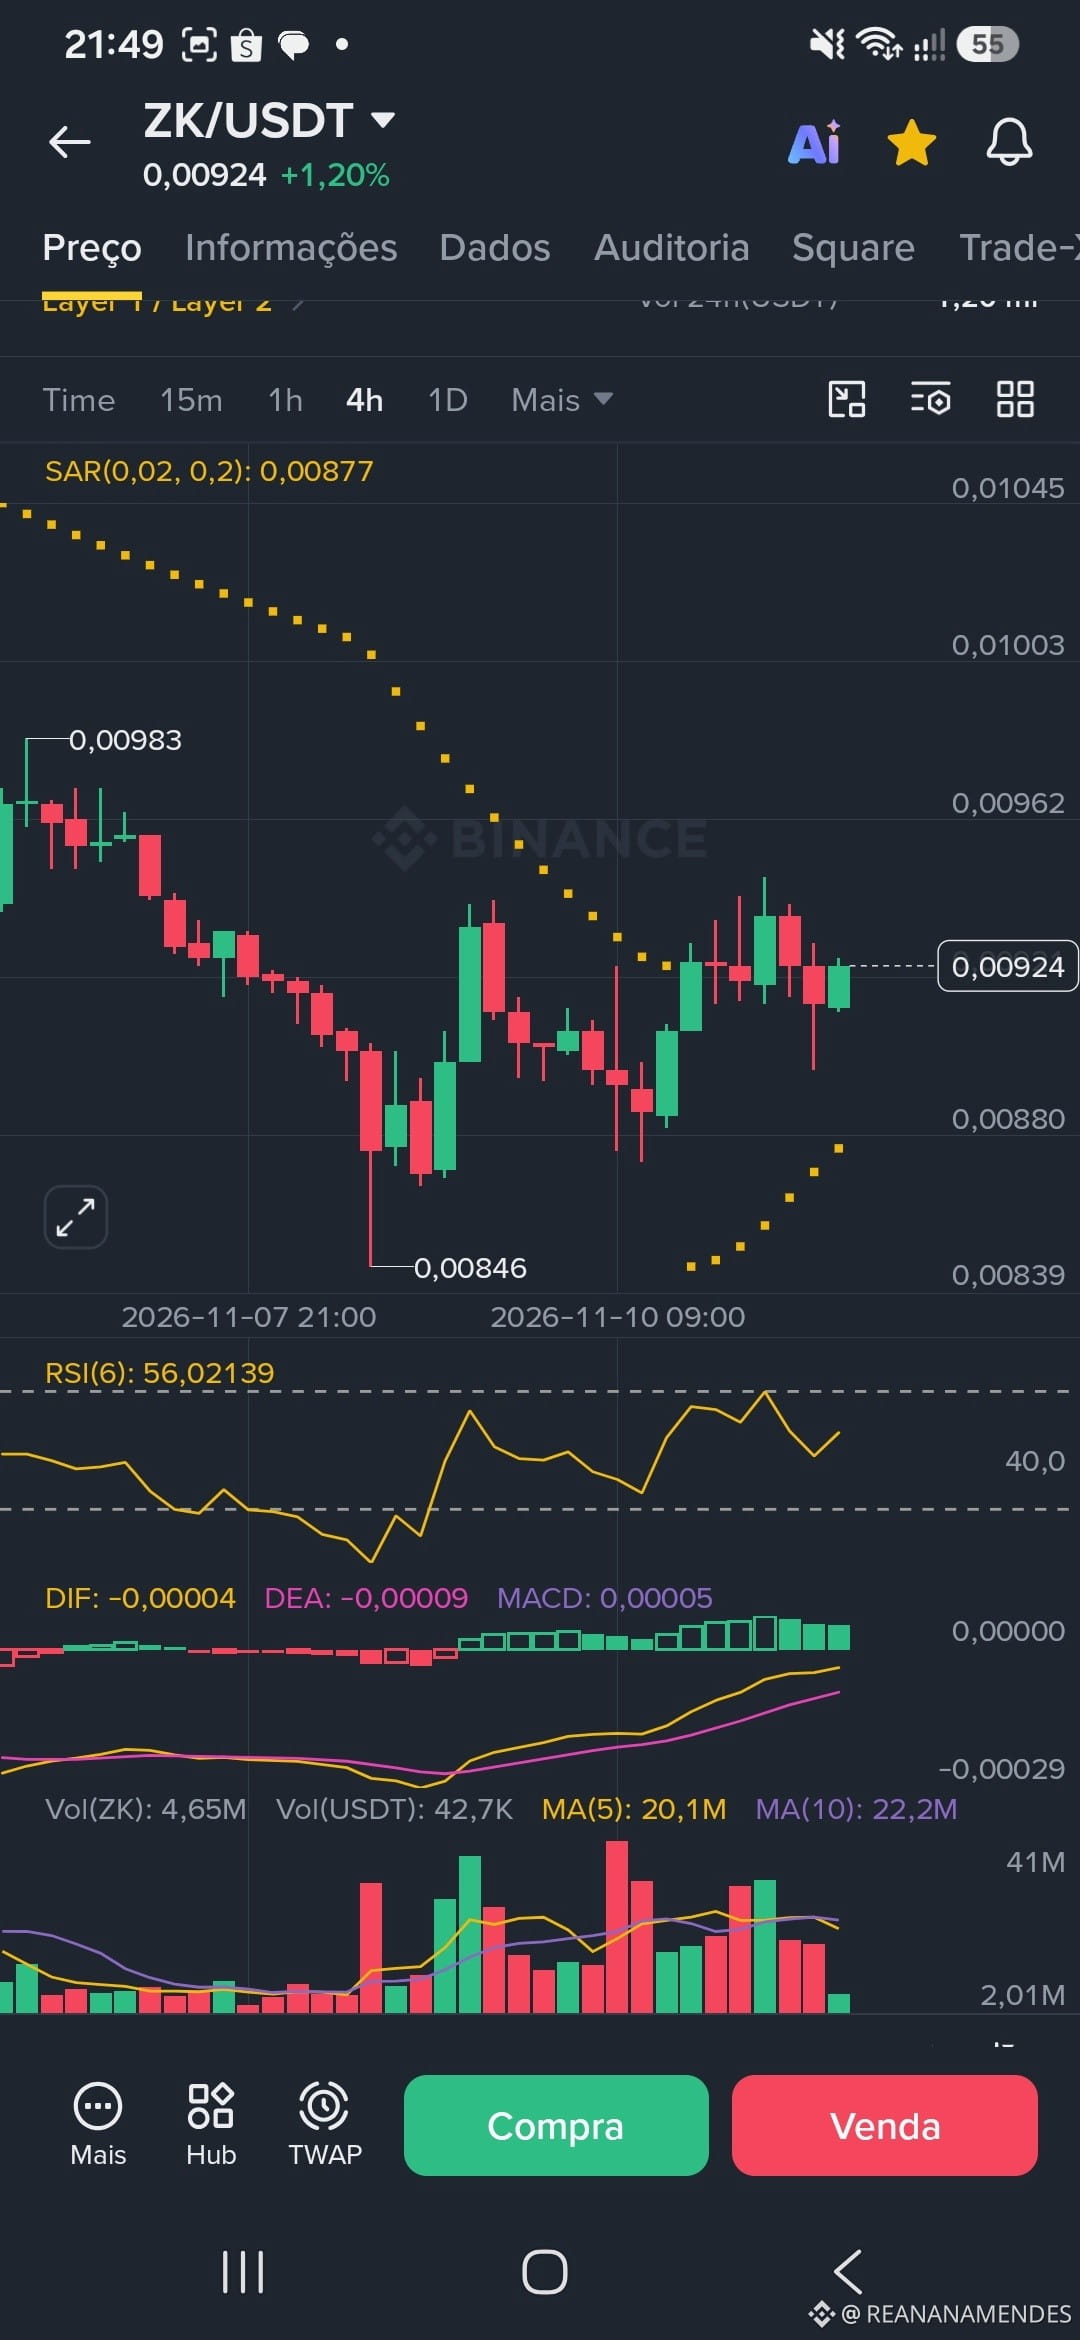
The asset found a significant bottom around $0.00846 and began a steady recovery.
The 4h Parabolic SAR has moved below the price (marked at $0.00877), indicating a possible medium-term trend shift from bearish to bullish.
The 4h MACD shows green histogram bars, with the lines crossing into positive territory, confirming buying momentum.
The RSI(6) is at 56.02, showing healthy room to rise without being overbought.
15-Minute Chart (Scalping and Momentum):
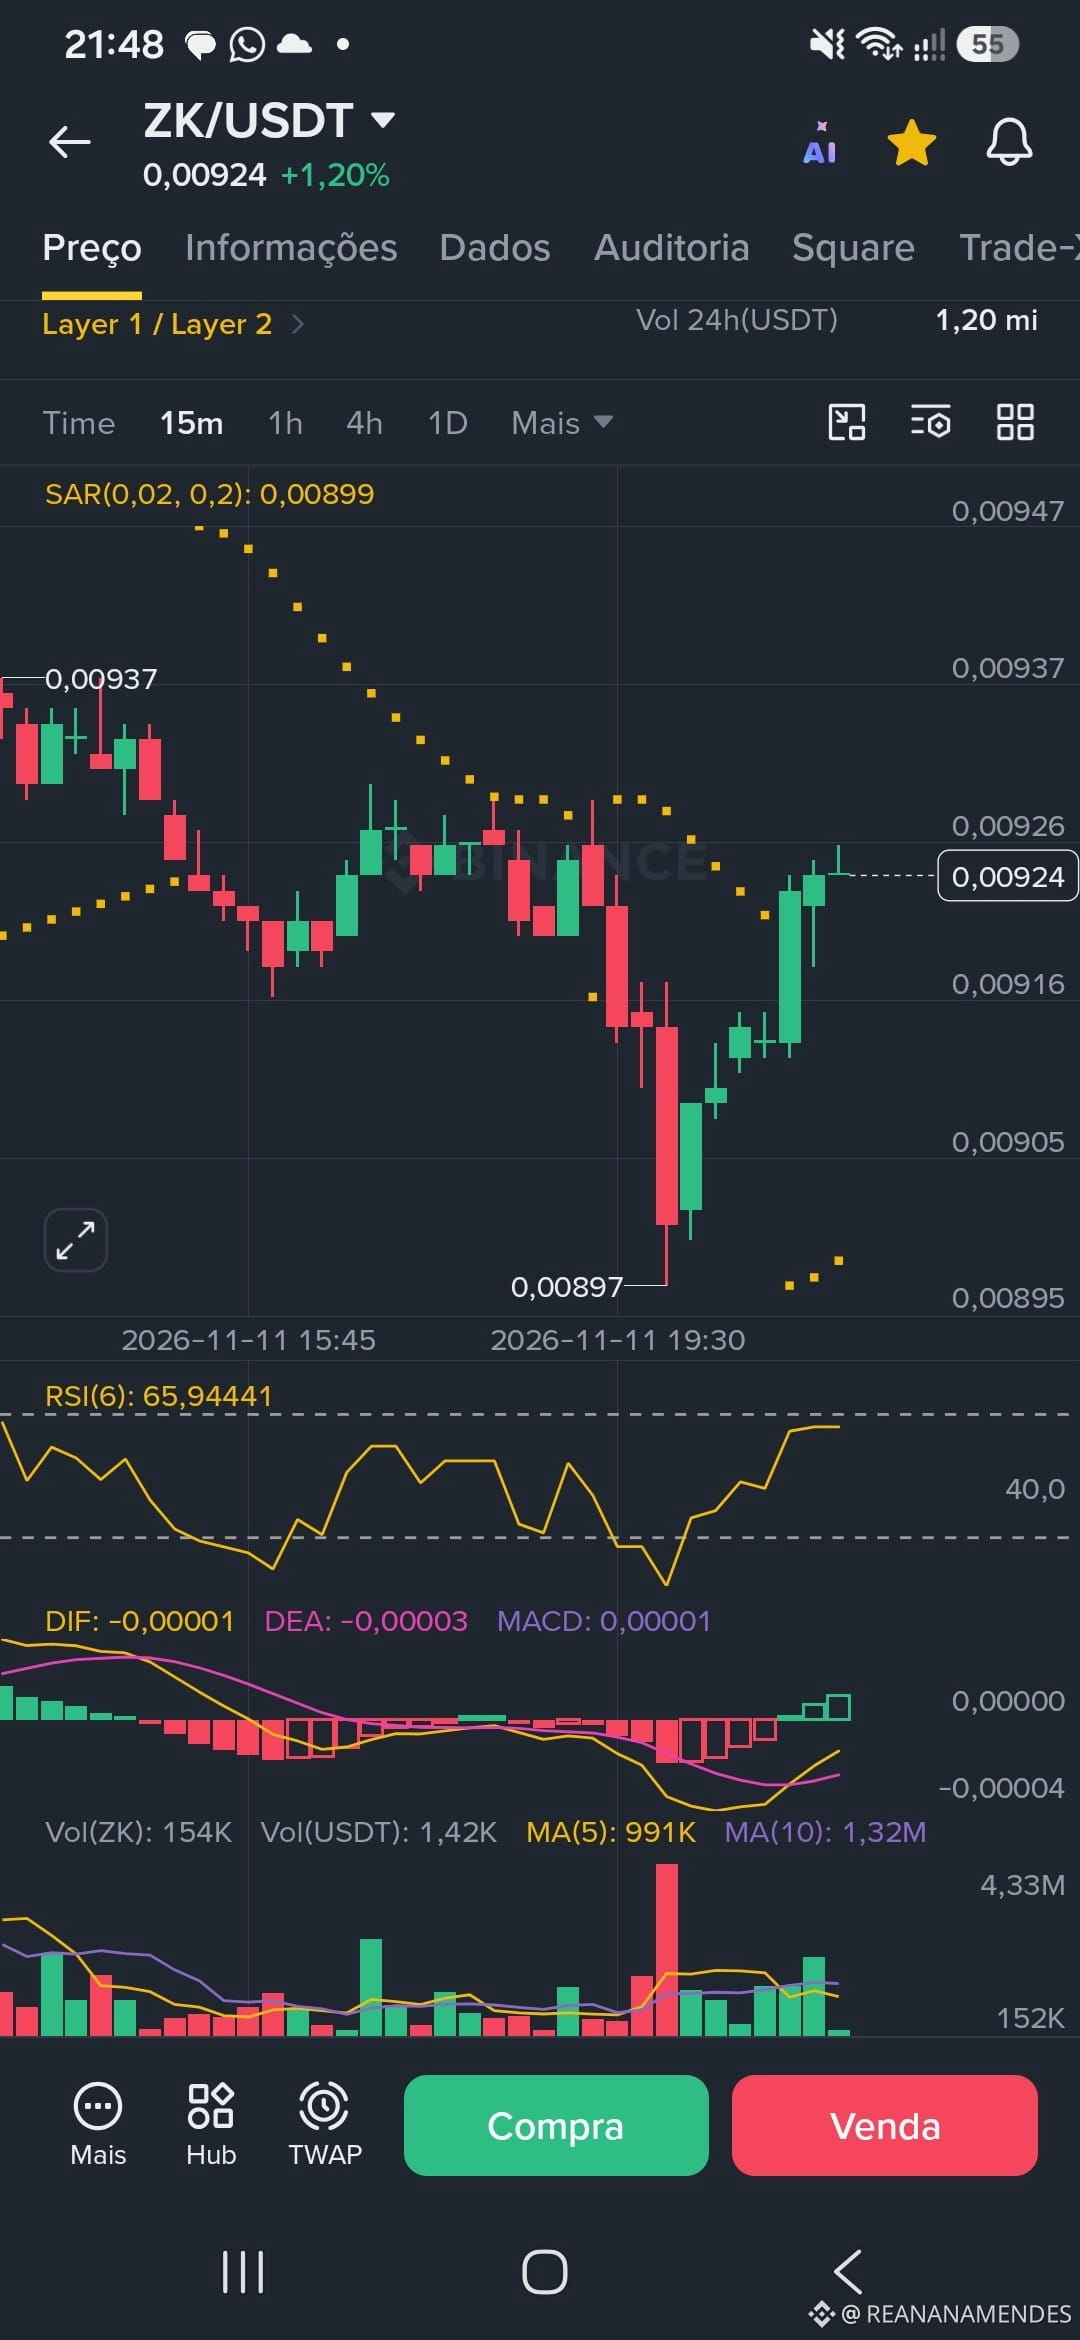
On the intraday chart, after testing the recent low of $0.00897, the price rebounded strongly to the current $0.00924 (+1.20%).
The 15m Parabolic SAR sits just below the current price ($0.00899), supporting short-term momentum.
The 15m RSI(6) is at 65.94, reflecting immediate buying strength, but calling for attention to possible quick pullbacks or consolidations before breaking through stronger resistance levels.
Hey, Binance Square traders! Let’s take a look at the ZK/USDT pair, which has been drawing attention with its latest moves on the 4h and 15m timeframes.
📊 Technical Analysis
4-Hour Chart (Trend and Pivot):
The asset found a significant bottom around $0.00846 and began a steady recovery.
The 4h Parabolic SAR has moved below the price (marked at $0.00877), indicating a possible medium-term trend shift from bearish to bullish.
The 4h MACD shows green histogram bars, with the lines crossing into positive territory, confirming buying momentum.
The RSI(6) is at 56.02, showing healthy room to rise without being overbought.
15-Minute Chart (Scalping and Momentum):
On the intraday chart, after testing the recent low of $0.00897, the price rebounded strongly to the current $0.00924 (+1.20%).
The 15m Parabolic SAR sits just below the current price ($0.00899), supporting short-term momentum.
The 15m RSI(6) is at 65.94, reflecting immediate buying strength, but calling for attention to possible quick pullbacks or consolidations before breaking through stronger resistance levels.