11.12 Chen Jie Morning Analysis
US October CPI rose 0.4% month over month, while core CPI held at 0.3% for a third consecutive month; both came in above expectations. Officials including Waller and Logan sent a steady stream of hawkish signals, lifting the market-implied probability of a December rate hike to 87%. The 10-year Treasury yield touched 5%, and the dollar hit a new high for the year. Contacts between the US and Iran, and between Russia and Ukraine, also cooled oil prices and safe-haven demand. Bearish factors outweighed support from central bank buying. Today, watch UK GDP, US initial jobless claims, the 30-year Treasury auction, and Hammack’s remarks.
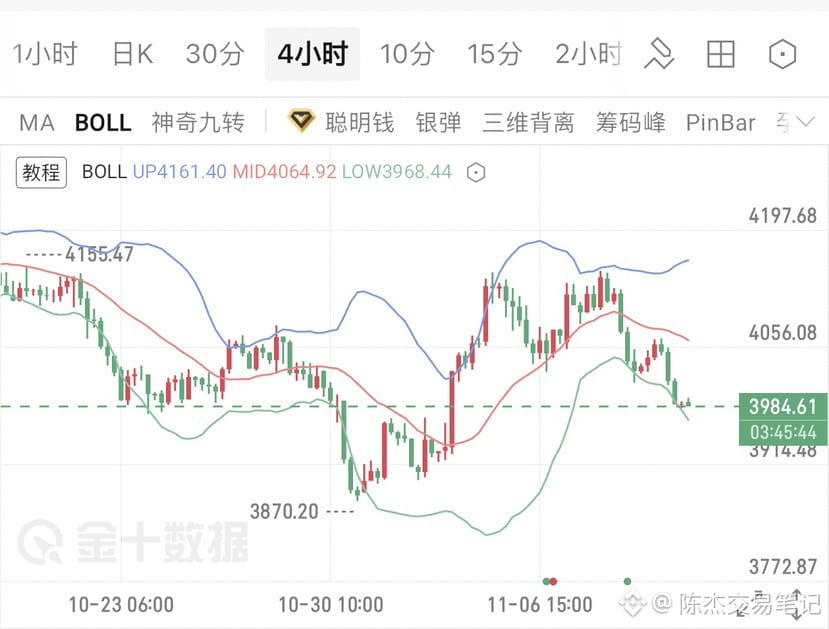
The daily chart has formed a run of bearish candles and an engulfing pattern from 4148, breaking below the daily middle band (4043) and the 4000 level. The 4-hour to 8-hour charts show a Three Black Crows pattern, with the MACD death cross and expanding green bars. However, after dipping to 3982, the 1-hour RSI fell to an extremely oversold 11.57. The 15-minute and 10-minute charts show a bullish MACD divergence and golden cross. The 3984 area is near the 6-hour lower band (3975) and the 2-hour lower band (3973). The 4003–4013 zone above combines the 30-minute middle band (4003) and a support-resistance flip level (4013); wait for a rebound to that area before entering.
Trading strategy
Short at 4000–4010; targets: 3970–3940–3900. Stop: 4032#xau $XAU
US October CPI rose 0.4% month over month, while core CPI held at 0.3% for a third consecutive month; both came in above expectations. Officials including Waller and Logan sent a steady stream of hawkish signals, lifting the market-implied probability of a December rate hike to 87%. The 10-year Treasury yield touched 5%, and the dollar hit a new high for the year. Contacts between the US and Iran, and between Russia and Ukraine, also cooled oil prices and safe-haven demand. Bearish factors outweighed support from central bank buying. Today, watch UK GDP, US initial jobless claims, the 30-year Treasury auction, and Hammack’s remarks.
The daily chart has formed a run of bearish candles and an engulfing pattern from 4148, breaking below the daily middle band (4043) and the 4000 level. The 4-hour to 8-hour charts show a Three Black Crows pattern, with the MACD death cross and expanding green bars. However, after dipping to 3982, the 1-hour RSI fell to an extremely oversold 11.57. The 15-minute and 10-minute charts show a bullish MACD divergence and golden cross. The 3984 area is near the 6-hour lower band (3975) and the 2-hour lower band (3973). The 4003–4013 zone above combines the 30-minute middle band (4003) and a support-resistance flip level (4013); wait for a rebound to that area before entering.
Trading strategy
Short at 4000–4010; targets: 3970–3940–3900. Stop: 4032#xau $XAU