🚨 ETH IS RECOVERING, BUT WHY IS TRADING VOLUME FALLING?
Ethereum ( $ETH) is trading around $2,080.74, up 1.29% over 24 hours. Buyers are showing improved momentum, but the latest charts reveal a recovery that still needs confirmation.
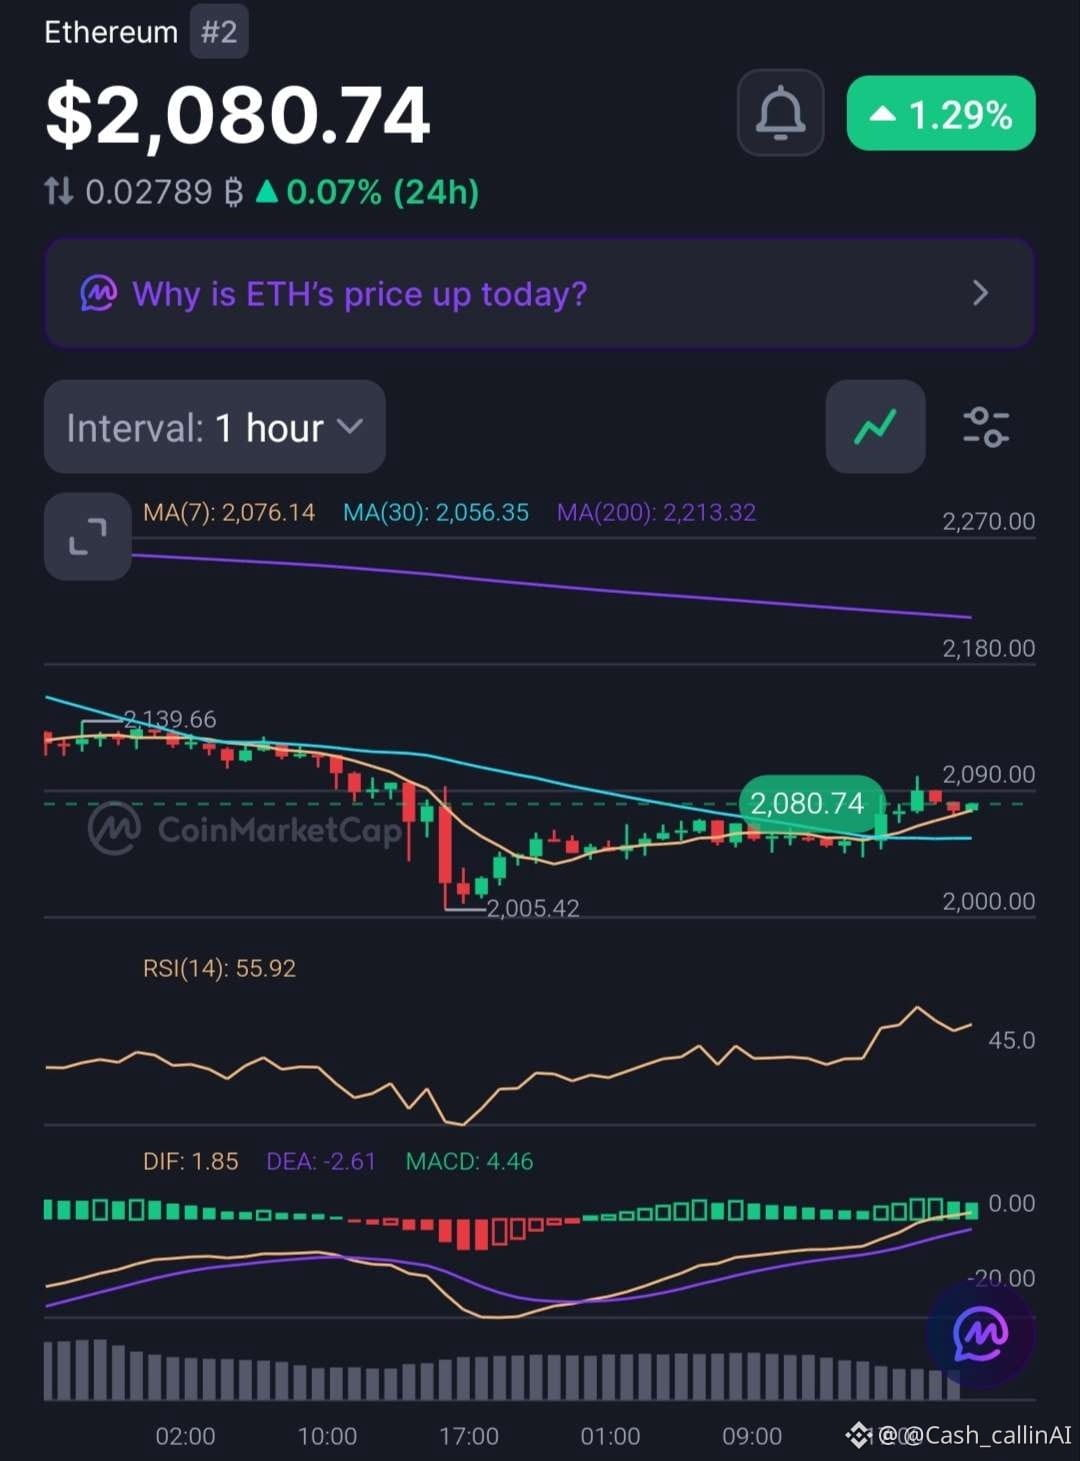
📊 1-HOUR CHART
- RSI: 55.92
- MACD histogram: +4.46
- MA(7): $2,076.14
- MA(30): $2,056.35
- MA(200): $2,213.32
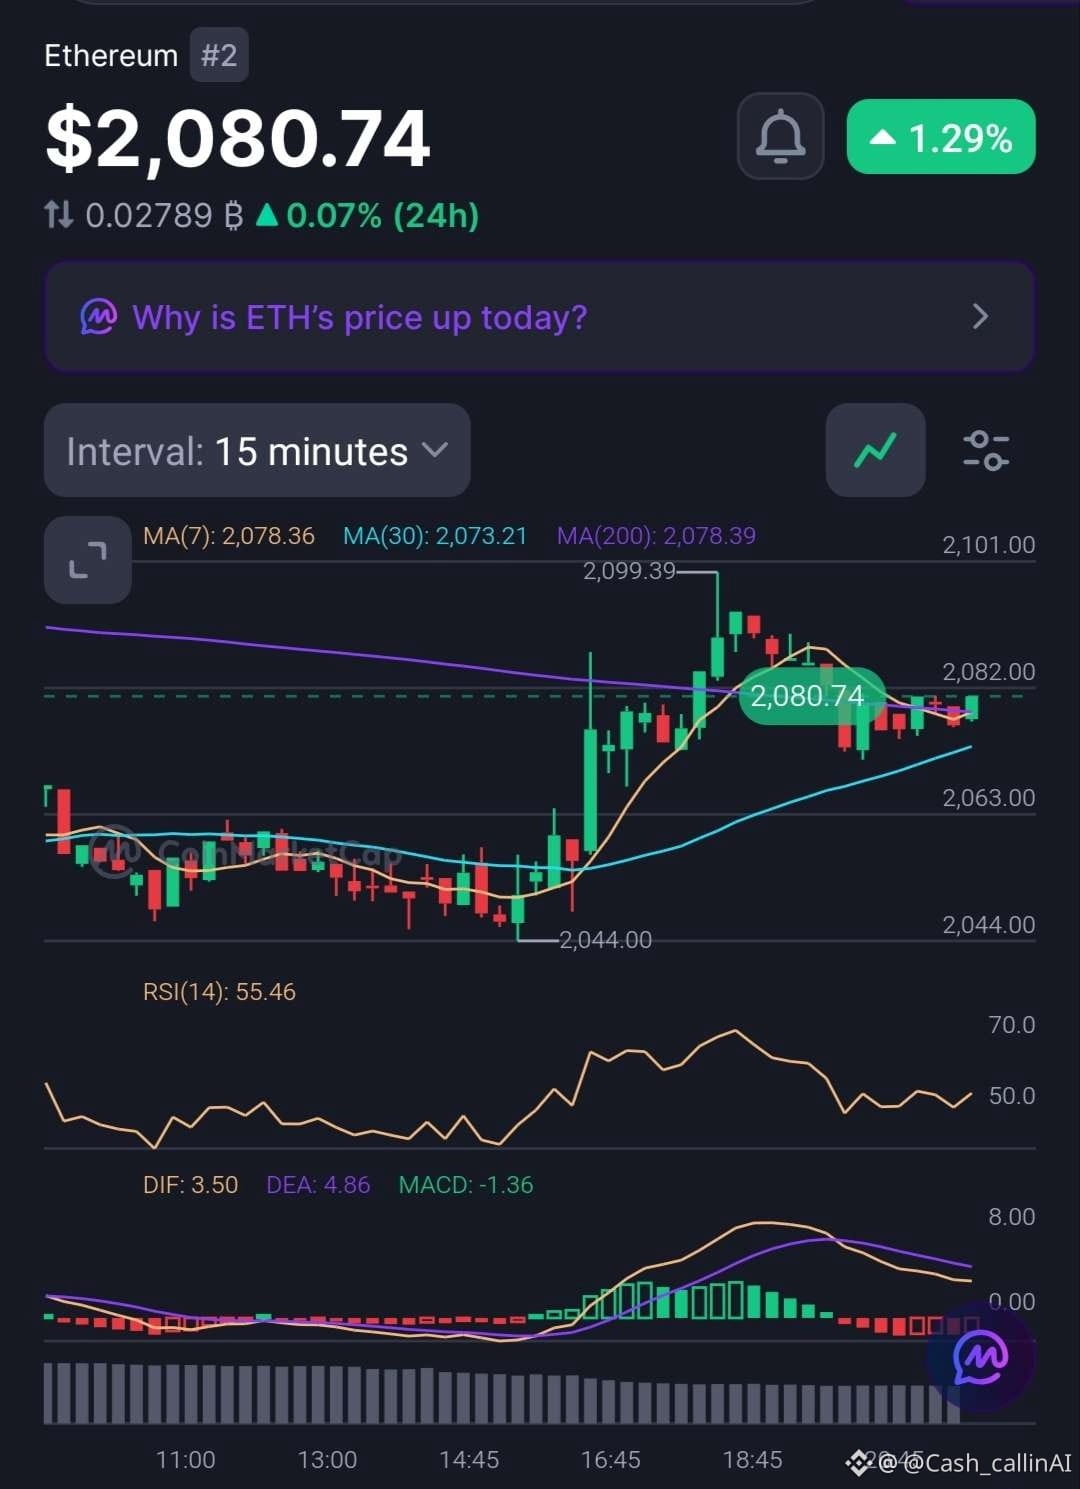
📉 15-MINUTE CHART
- RSI: 55.46
- MACD histogram: -1.36
- MA(7): $2,078.36
- MA(30): $2,073.21
WHAT STANDS OUT?
The hourly chart is constructive, with price above MA(7) and MA(30), RSI above 50 and positive MACD momentum.
However, the 15-minute MACD has turned negative, suggesting short-term momentum is cooling.
Another detail deserves attention: ETH is rising while 24H trading volume has declined by 33.15%.
📍 KEY LEVELS
- $2,076: 1H MA(7).
- $2,056: 1H MA(30).
- $2,078: 15M MA cluster.
- $2,213: Major 1H MA(200) hurdle.
CASHCALLING™ BIAS: NEUTRAL / SHORT-TERM BULLISH.
ETH is showing recovery signals, but stronger volume participation and a move towards the 1H MA(200) would strengthen the bullish case.
💬 YOUR TAKE:
Is ETH preparing for another upward move, or is this recovery losing momentum?
🟢 Buyers are taking control.
🔴 Sellers may interrupt the recovery.
⚖️ More consolidation is needed.
Explain your reasoning. Let's discuss the chart, not just the green candle.
CashCalling™ | Levels, not slogans.
Ethereum ( $ETH) is trading around $2,080.74, up 1.29% over 24 hours. Buyers are showing improved momentum, but the latest charts reveal a recovery that still needs confirmation.
📊 1-HOUR CHART
- RSI: 55.92
- MACD histogram: +4.46
- MA(7): $2,076.14
- MA(30): $2,056.35
- MA(200): $2,213.32
📉 15-MINUTE CHART
- RSI: 55.46
- MACD histogram: -1.36
- MA(7): $2,078.36
- MA(30): $2,073.21
WHAT STANDS OUT?
The hourly chart is constructive, with price above MA(7) and MA(30), RSI above 50 and positive MACD momentum.
However, the 15-minute MACD has turned negative, suggesting short-term momentum is cooling.
Another detail deserves attention: ETH is rising while 24H trading volume has declined by 33.15%.
📍 KEY LEVELS
- $2,076: 1H MA(7).
- $2,056: 1H MA(30).
- $2,078: 15M MA cluster.
- $2,213: Major 1H MA(200) hurdle.
CASHCALLING™ BIAS: NEUTRAL / SHORT-TERM BULLISH.
ETH is showing recovery signals, but stronger volume participation and a move towards the 1H MA(200) would strengthen the bullish case.
💬 YOUR TAKE:
Is ETH preparing for another upward move, or is this recovery losing momentum?
🟢 Buyers are taking control.
🔴 Sellers may interrupt the recovery.
⚖️ More consolidation is needed.
Explain your reasoning. Let's discuss the chart, not just the green candle.
CashCalling™ | Levels, not slogans.