🚨 SOL IS UP 2.33% — BUT WHY IS TRADING VOLUME FALLING?
Solana ( $SOL) is trading around $84.76, showing a recovery across the market. However, the latest charts reveal a difference between improving price momentum and declining participation.
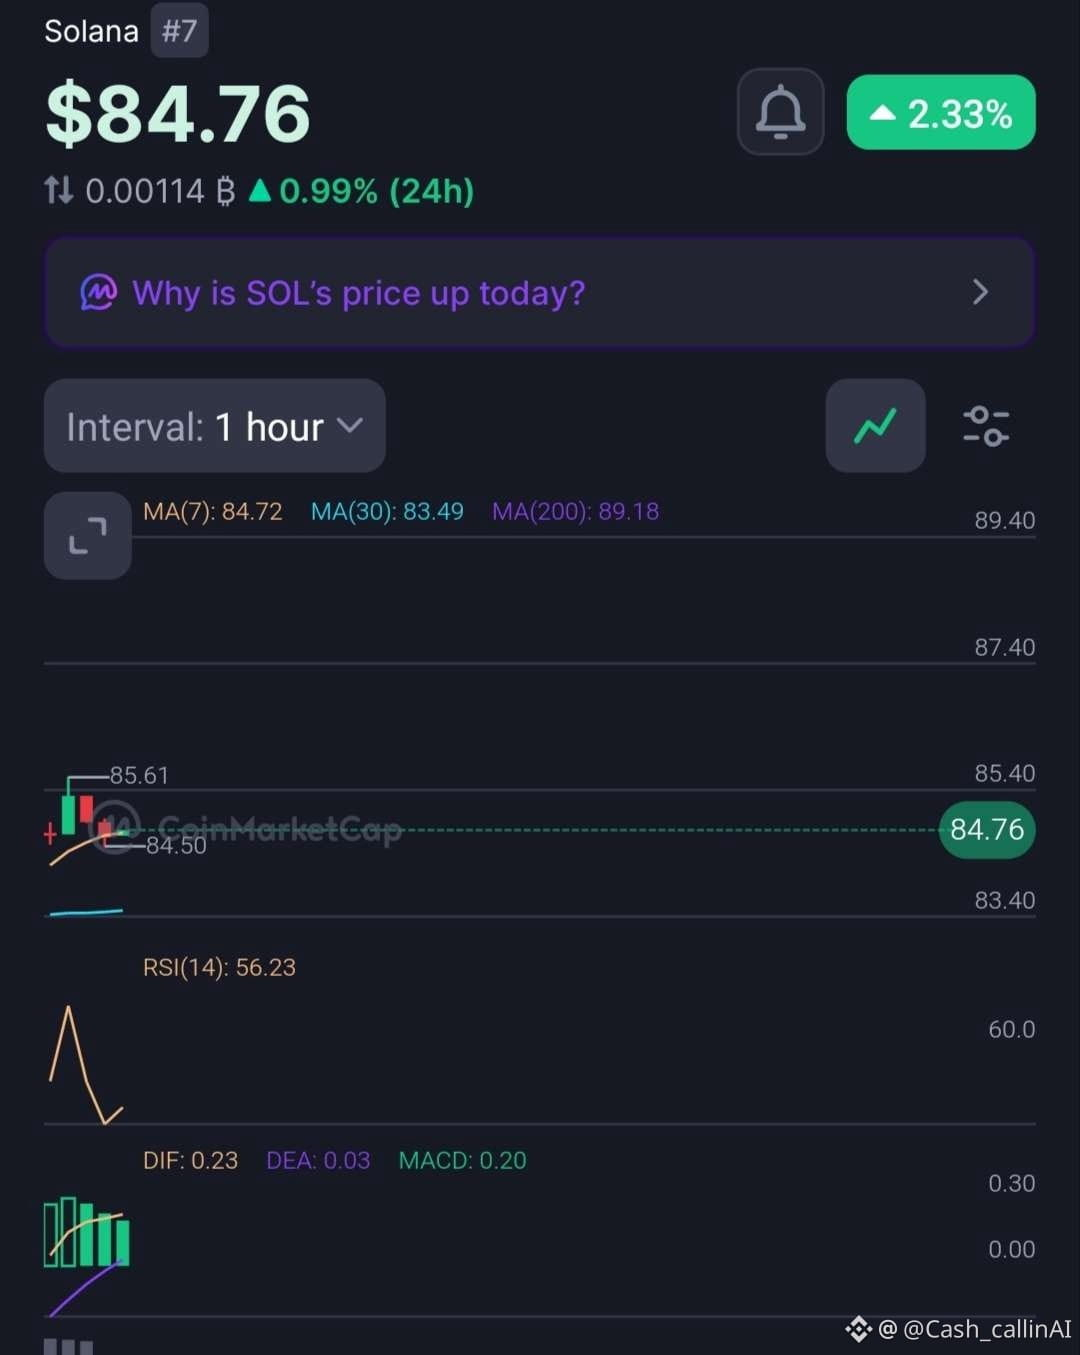
🔍 1-HOUR CHART
- RSI: 56.23
- MACD histogram: +0.20
- MA(7): $84.72
- MA(30): $83.49
- MA(200): $89.18
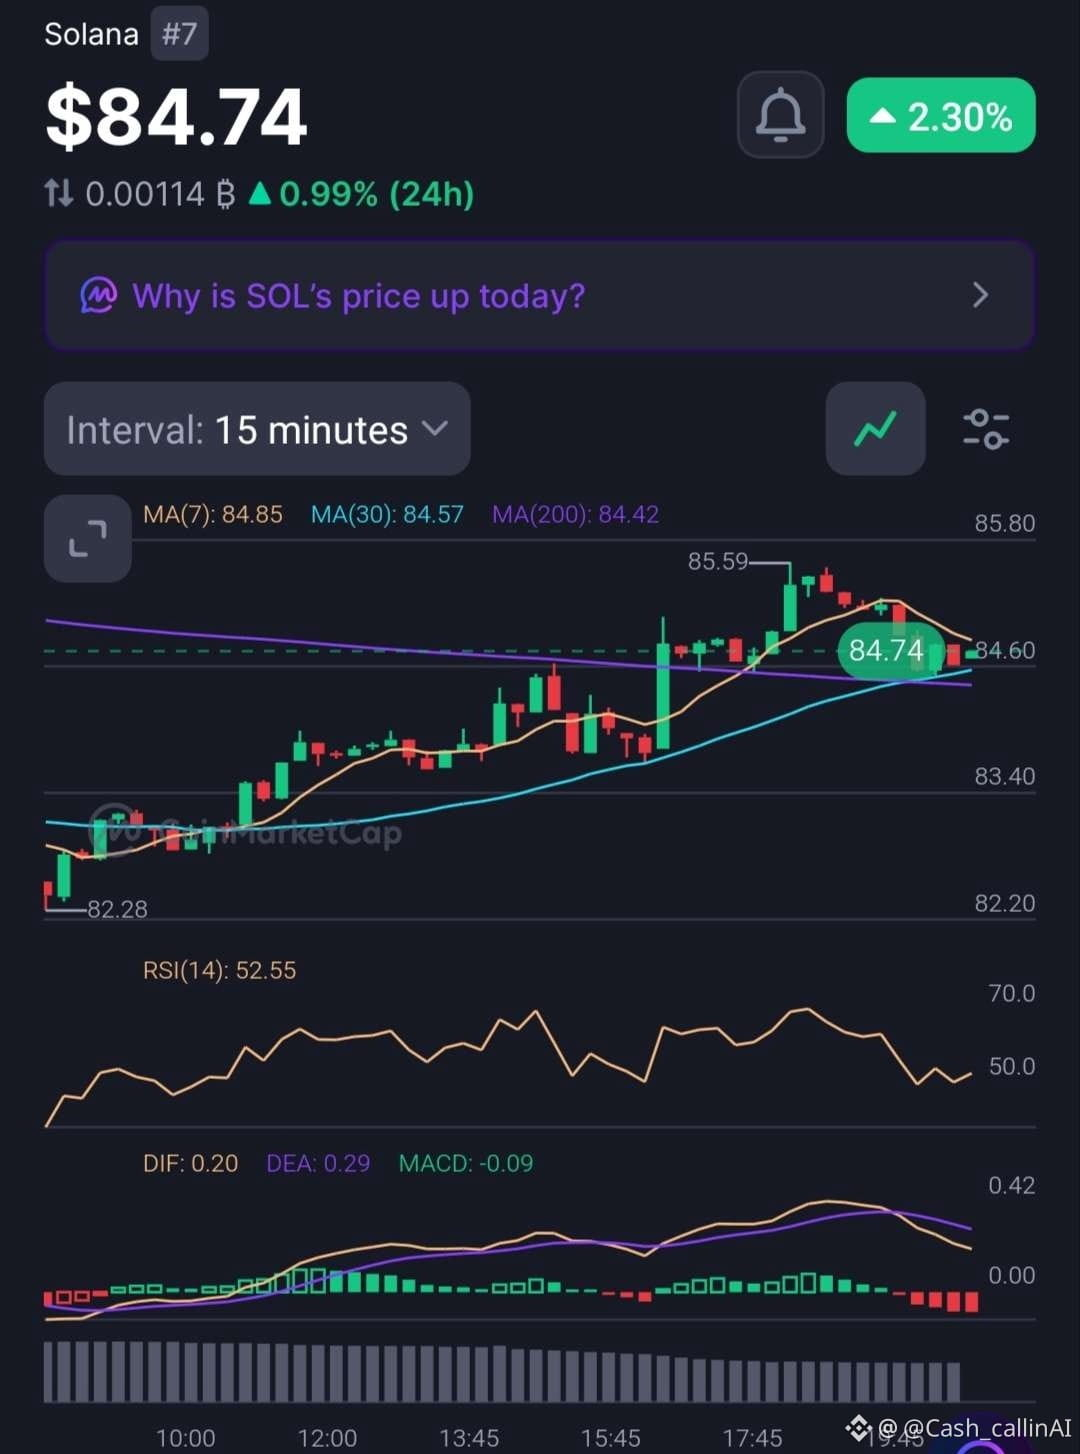
🔍 15-MINUTE CHART
- RSI: 52.55
- MACD histogram: -0.09
- MA(200): $84.42
📊 MARKET SNAPSHOT
- Market Cap: $50.07B
- 24H Volume: $2.02B (-32.64%)
- FDV: $53.96B
- YTD: -31.90%
WHAT MATTERS NOW?
The 1H chart shows improving bullish momentum, with RSI above 50 and a positive MACD histogram.
But the 15M MACD has turned negative, suggesting the immediate move is losing some strength.
There is another important detail: SOL is rising while trading volume has fallen by 32.64%. That deserves attention.
📍 LEVELS TO WATCH
- $85.59: Recent chart high.
- $84.42: 15M MA(200).
- $83.49: 1H MA(30).
- $89.18: 1H MA(200).
🟡 CASHCALLING™ BIAS: SHORT-TERM BULLISH, WITH CAUTION.
A sustained break above $85.59 could strengthen the recovery. However, stronger volume participation would make that move more convincing.
💬 WHAT'S YOUR READ ON SOL?
🟢 Buyers are preparing another upward move.
🔴 The rally is losing strength without volume confirmation.
⚖️ SOL needs more consolidation.
Don't just pick a side. Explain what the indicators are telling you.
CashCalling™ | Levels, not slogans.
Solana ( $SOL) is trading around $84.76, showing a recovery across the market. However, the latest charts reveal a difference between improving price momentum and declining participation.
🔍 1-HOUR CHART
- RSI: 56.23
- MACD histogram: +0.20
- MA(7): $84.72
- MA(30): $83.49
- MA(200): $89.18
🔍 15-MINUTE CHART
- RSI: 52.55
- MACD histogram: -0.09
- MA(200): $84.42
📊 MARKET SNAPSHOT
- Market Cap: $50.07B
- 24H Volume: $2.02B (-32.64%)
- FDV: $53.96B
- YTD: -31.90%
WHAT MATTERS NOW?
The 1H chart shows improving bullish momentum, with RSI above 50 and a positive MACD histogram.
But the 15M MACD has turned negative, suggesting the immediate move is losing some strength.
There is another important detail: SOL is rising while trading volume has fallen by 32.64%. That deserves attention.
📍 LEVELS TO WATCH
- $85.59: Recent chart high.
- $84.42: 15M MA(200).
- $83.49: 1H MA(30).
- $89.18: 1H MA(200).
🟡 CASHCALLING™ BIAS: SHORT-TERM BULLISH, WITH CAUTION.
A sustained break above $85.59 could strengthen the recovery. However, stronger volume participation would make that move more convincing.
💬 WHAT'S YOUR READ ON SOL?
🟢 Buyers are preparing another upward move.
🔴 The rally is losing strength without volume confirmation.
⚖️ SOL needs more consolidation.
Don't just pick a side. Explain what the indicators are telling you.
CashCalling™ | Levels, not slogans.