🔥 $ETH Technical Update: Key Levels & Momentum Breakdown
📊 1. Market Snapshot
$ETH is currently trading at $2,078.31, registering a modest 24-hour gain of +1.69%. Price action has moved within a daily range between a low of $2,039.70 and a high of $2,103.78, accompanied by a 24-hour quote volume of approximately $386.13 million USDT.
📈 2. Technical Momentum & Indicator Bias
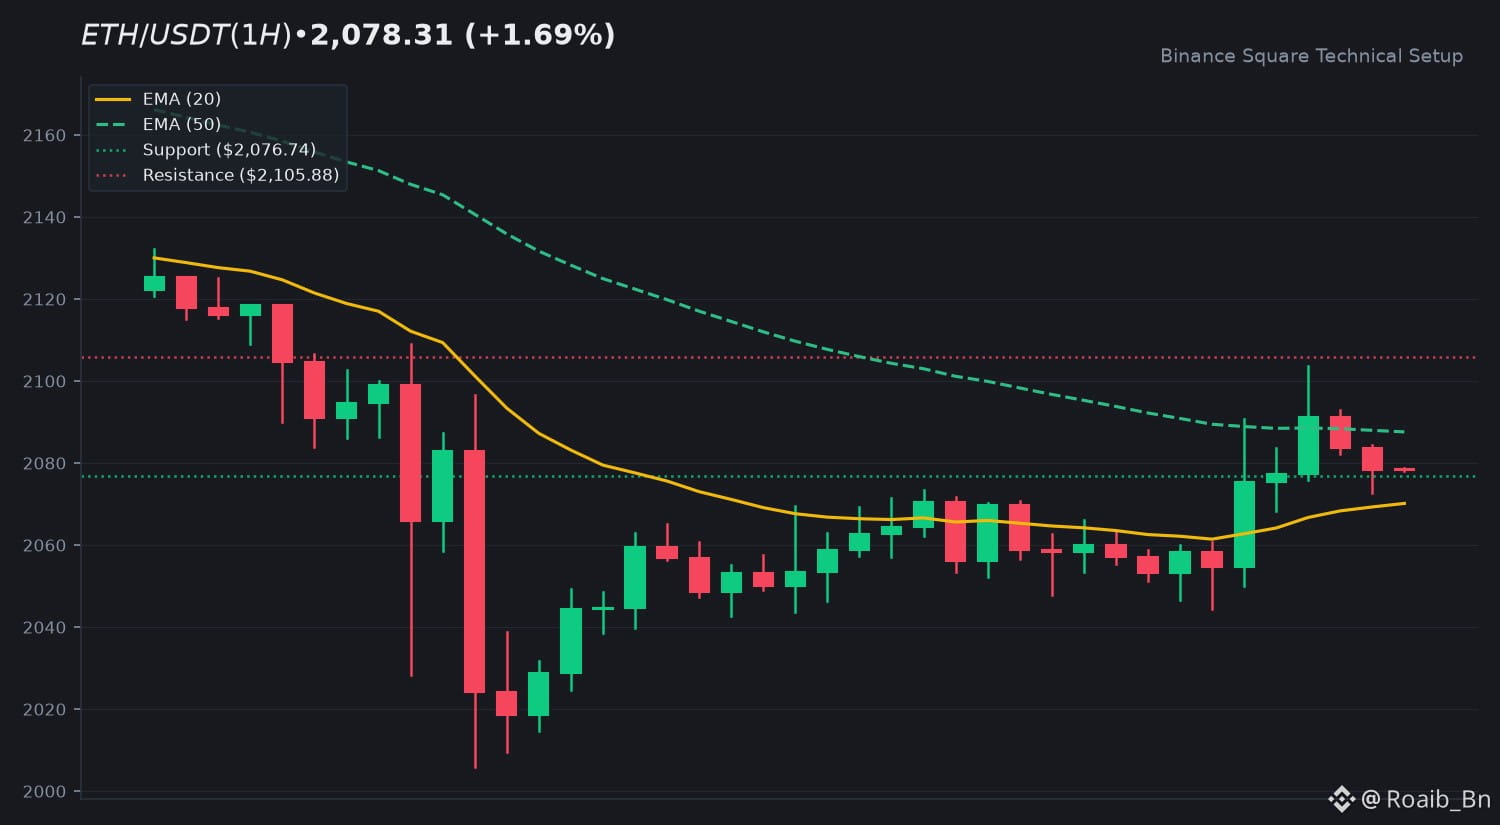
The technical posture shows a minor bullish recovery and trend reversal attempt. The 14-period RSI sits at 53.69, reflecting a neutral-to-mildly positive momentum state without extreme overbought conditions. The MACD histogram prints positive at +4.14, with the MACD line crossing above the signal line. Meanwhile, price is hovering right near the EMA 20 ($2,070.16) and just below the EMA 50 ($2,087.60), signaling a consolidation phase where market participants await stronger volume confirmation.
🎯 3. Key Technical Levels to Watch
• 🟢 Resistance Zone: First overhead ceiling sits at $2,105.88, with a higher extension target located near $2,243.29.
• 🔴 Support Zone: Immediate support floor is established at $2,076.74, backed by a deeper technical base at $2,006.00.
• 🛡️ Pivot Confluence: The EMA 20 and EMA 50 convergence acts as the vital short-term pivot area for trend direction.
💡 4. Technical Takeaway & Risk Management
Market participants are monitoring how price interacts with the moving average stack under current low volume conditions. Maintaining composure and applying strict risk management are essential when volatility is low.
💬 5. Community Discussion
What is your technical outlook for $ETH this week? Are you tracking the moving averages or waiting for volume confirmation? Drop your thoughts below! 👇
⚠️ 6. Disclaimer
Educational technical analysis only. Not financial advice (NFA). Crypto markets involve risk. Always DYOR.
$ETH #ETH #BinanceSquare
📊 1. Market Snapshot
$ETH is currently trading at $2,078.31, registering a modest 24-hour gain of +1.69%. Price action has moved within a daily range between a low of $2,039.70 and a high of $2,103.78, accompanied by a 24-hour quote volume of approximately $386.13 million USDT.
📈 2. Technical Momentum & Indicator Bias
The technical posture shows a minor bullish recovery and trend reversal attempt. The 14-period RSI sits at 53.69, reflecting a neutral-to-mildly positive momentum state without extreme overbought conditions. The MACD histogram prints positive at +4.14, with the MACD line crossing above the signal line. Meanwhile, price is hovering right near the EMA 20 ($2,070.16) and just below the EMA 50 ($2,087.60), signaling a consolidation phase where market participants await stronger volume confirmation.
🎯 3. Key Technical Levels to Watch
• 🟢 Resistance Zone: First overhead ceiling sits at $2,105.88, with a higher extension target located near $2,243.29.
• 🔴 Support Zone: Immediate support floor is established at $2,076.74, backed by a deeper technical base at $2,006.00.
• 🛡️ Pivot Confluence: The EMA 20 and EMA 50 convergence acts as the vital short-term pivot area for trend direction.
💡 4. Technical Takeaway & Risk Management
Market participants are monitoring how price interacts with the moving average stack under current low volume conditions. Maintaining composure and applying strict risk management are essential when volatility is low.
💬 5. Community Discussion
What is your technical outlook for $ETH this week? Are you tracking the moving averages or waiting for volume confirmation? Drop your thoughts below! 👇
⚠️ 6. Disclaimer
Educational technical analysis only. Not financial advice (NFA). Crypto markets involve risk. Always DYOR.
$ETH #ETH #BinanceSquare