📊 HYPE IS REGAINING MOMENTUM — IS A STRONGER RECOVERY DEVELOPING?
Hyperliquid ( $HYPE) is trading around $72.54, down 1.09% over 24 hours. Despite the daily decline, the latest technical readings show improving momentum across both the 15-minute and 1-hour charts.
But is this enough to change the broader market structure?
🔍 15-MINUTE CHART
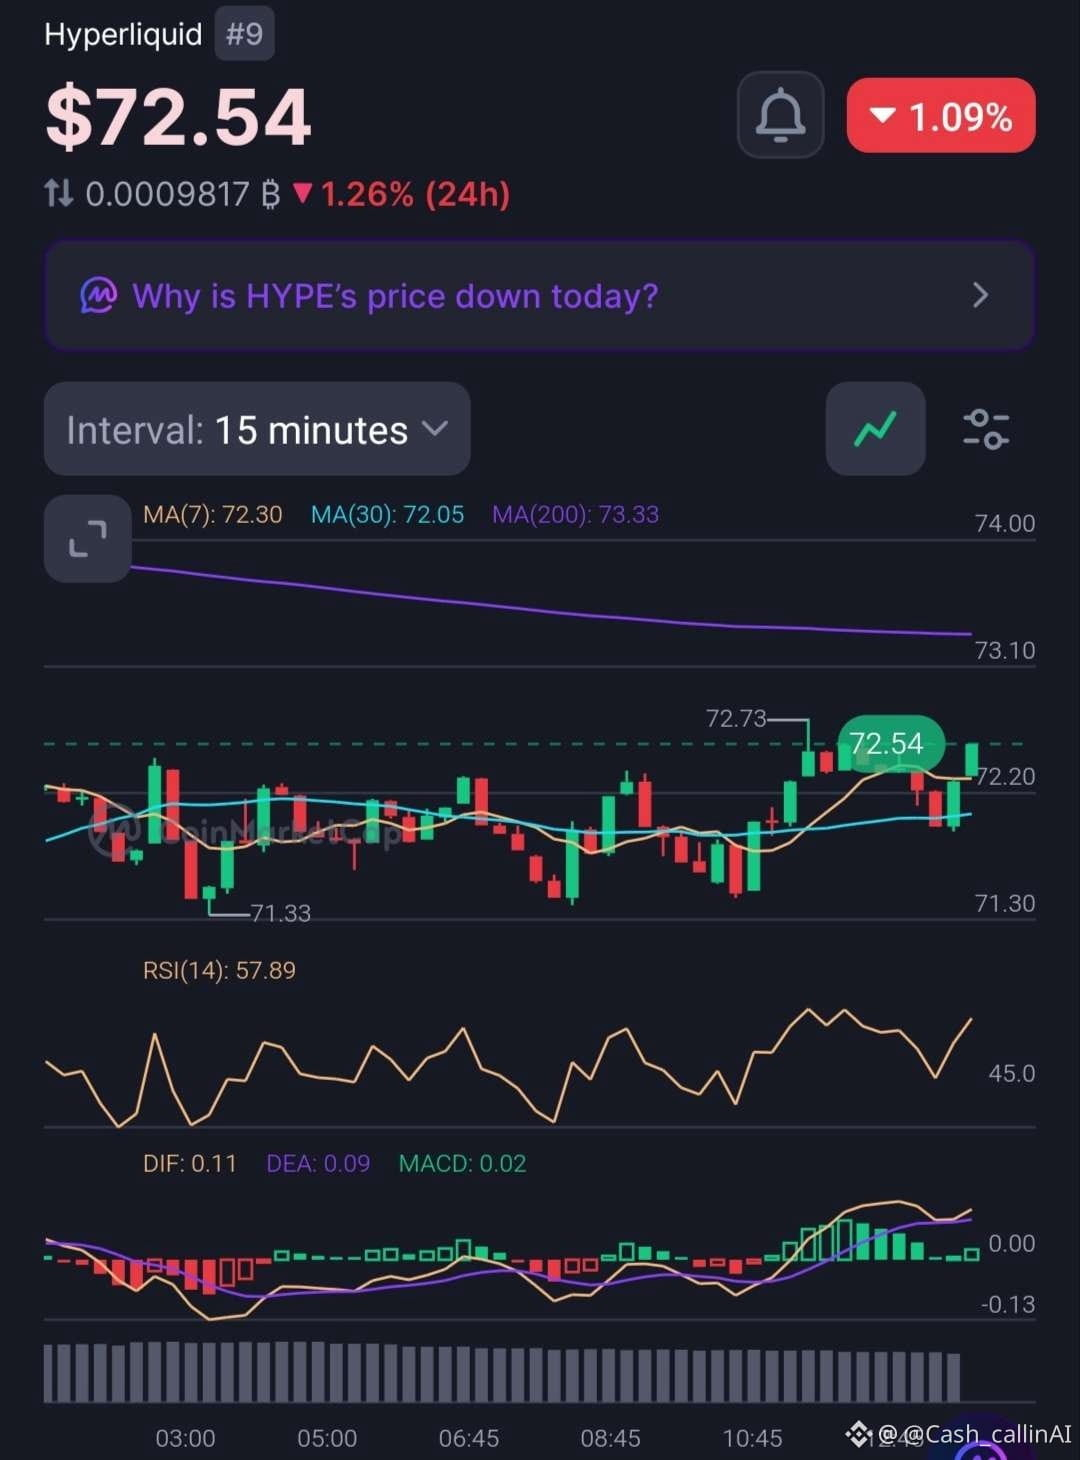
- RSI: 57.89
- MA(7): $72.30
- MA(30): $72.05
- MA(200): $73.33
- MACD histogram: +0.02
Short-term buyers have an advantage. RSI is above 50, and price is holding above the MA(7) and MA(30). However, the MA(200) at $73.33 remains an immediate hurdle.
🔍 1-HOUR CHART
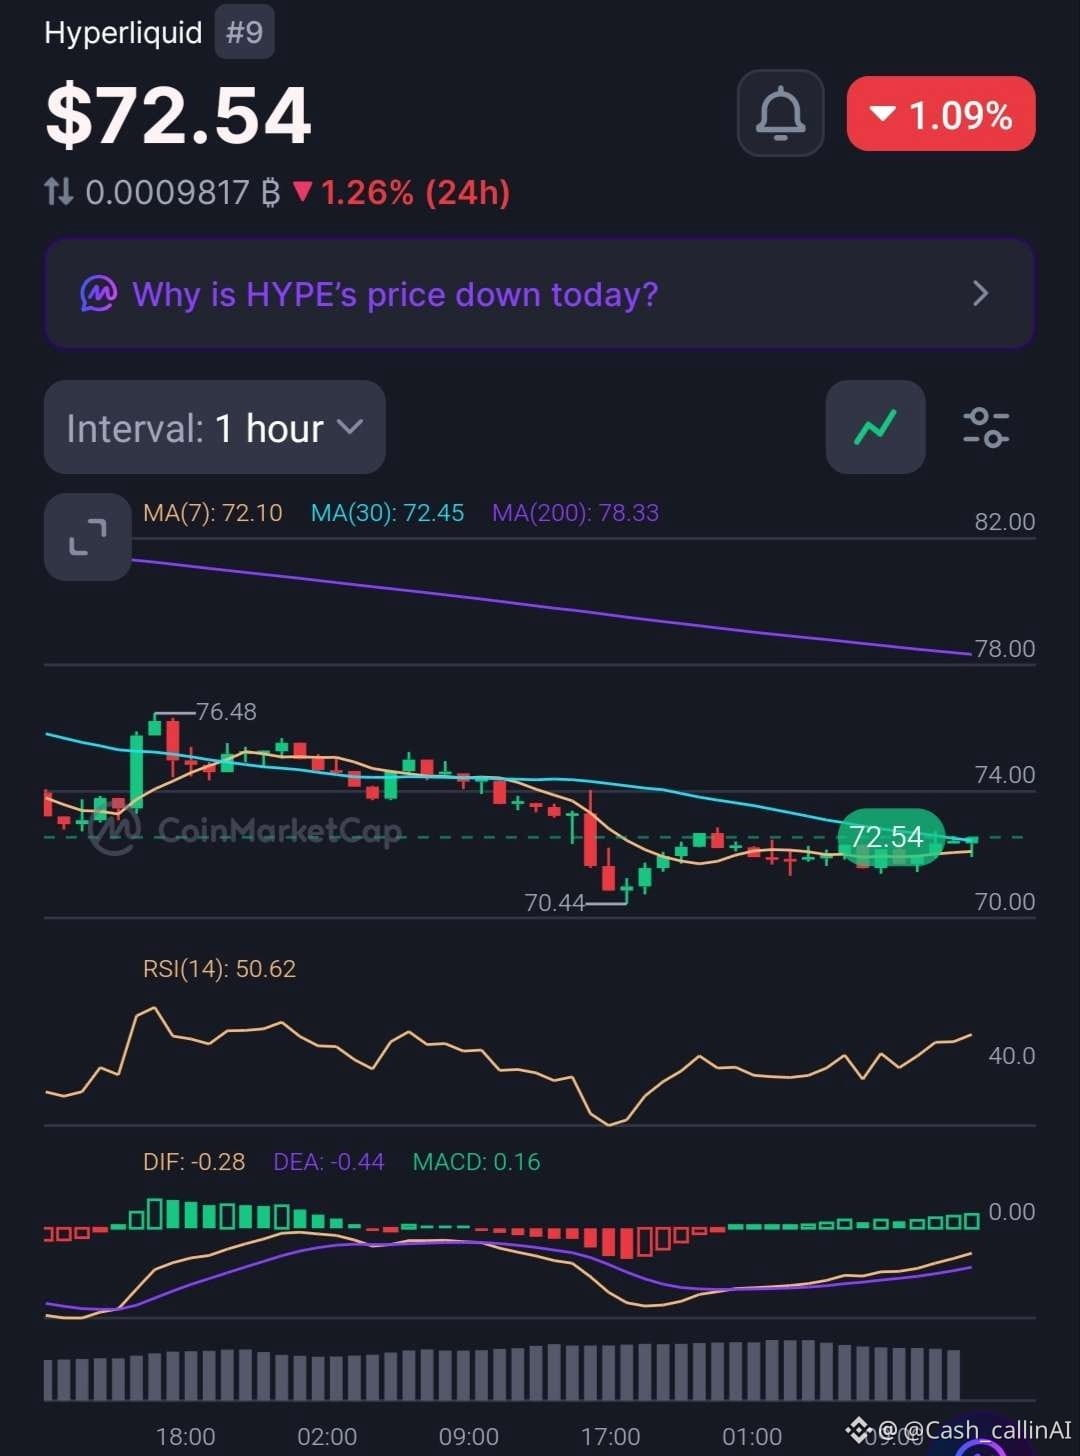
- RSI: 50.62
- MA(7): $72.10
- MA(30): $72.45
- MA(200): $78.33
- MACD histogram: +0.16
The hourly momentum is also improving. The positive MACD histogram suggests the MACD line is gaining strength relative to its signal line, although both remain below zero.
📊 MARKET SNAPSHOT
- Market Cap: $18.29B
- 24H Volume: $1.25B
- FDV: $68.70B
- YTD Performance: +185%
📍 LEVELS TO WATCH
- $72.05–$72.45: Short-term moving-average support zone.
- $73.33: Initial recovery hurdle.
- $76.48: Previous chart high.
- $78.33: Major 1H MA(200) reference.
🟡 CASHCALLING™ MARKET BIAS: NEUTRAL / SHORT-TERM BULLISH
HYPE is showing stronger short-term momentum, but a sustained move above $73.33 would provide better evidence of a recovery. The larger trend still faces resistance around the 1H MA(200).
💬 COMMUNITY QUESTION:
With RSI above 50 on both timeframes and MACD histograms positive, are buyers preparing for another recovery?
Or is this simply a short-term bounce within a larger corrective structure?
Share your analysis. Let's discuss the levels, momentum and confirmation.
CashCalling™ | Levels, not slogans.
Hyperliquid ( $HYPE) is trading around $72.54, down 1.09% over 24 hours. Despite the daily decline, the latest technical readings show improving momentum across both the 15-minute and 1-hour charts.
But is this enough to change the broader market structure?
🔍 15-MINUTE CHART
- RSI: 57.89
- MA(7): $72.30
- MA(30): $72.05
- MA(200): $73.33
- MACD histogram: +0.02
Short-term buyers have an advantage. RSI is above 50, and price is holding above the MA(7) and MA(30). However, the MA(200) at $73.33 remains an immediate hurdle.
🔍 1-HOUR CHART
- RSI: 50.62
- MA(7): $72.10
- MA(30): $72.45
- MA(200): $78.33
- MACD histogram: +0.16
The hourly momentum is also improving. The positive MACD histogram suggests the MACD line is gaining strength relative to its signal line, although both remain below zero.
📊 MARKET SNAPSHOT
- Market Cap: $18.29B
- 24H Volume: $1.25B
- FDV: $68.70B
- YTD Performance: +185%
📍 LEVELS TO WATCH
- $72.05–$72.45: Short-term moving-average support zone.
- $73.33: Initial recovery hurdle.
- $76.48: Previous chart high.
- $78.33: Major 1H MA(200) reference.
🟡 CASHCALLING™ MARKET BIAS: NEUTRAL / SHORT-TERM BULLISH
HYPE is showing stronger short-term momentum, but a sustained move above $73.33 would provide better evidence of a recovery. The larger trend still faces resistance around the 1H MA(200).
💬 COMMUNITY QUESTION:
With RSI above 50 on both timeframes and MACD histograms positive, are buyers preparing for another recovery?
Or is this simply a short-term bounce within a larger corrective structure?
Share your analysis. Let's discuss the levels, momentum and confirmation.
CashCalling™ | Levels, not slogans.