$BTC Crypto Market Academician: 11.12 Bitcoin (BTC): For those who wake up in the middle of the night to check the charts on their phones, this article is for you
While writing this, I double-checked the figures three times. Lately, a lot of people have messaged me asking, "Chen, is it okay to buy the dip now?" My answer is always the same: You can give it a try, but only use money you can afford to lose without affecting your life, and set your stop-loss in the order beforehand. The market has no shortage of "I think"; what it lacks most is "If I'm wrong, I'll get out." On this move down from 87000, how many people kept adding to their positions, then got trapped, all because they felt "it can't go any lower"? Once this bottoming process is over, whichever direction you choose, I hope you enter with a plan in hand rather than letting a single candlestick lead you around.
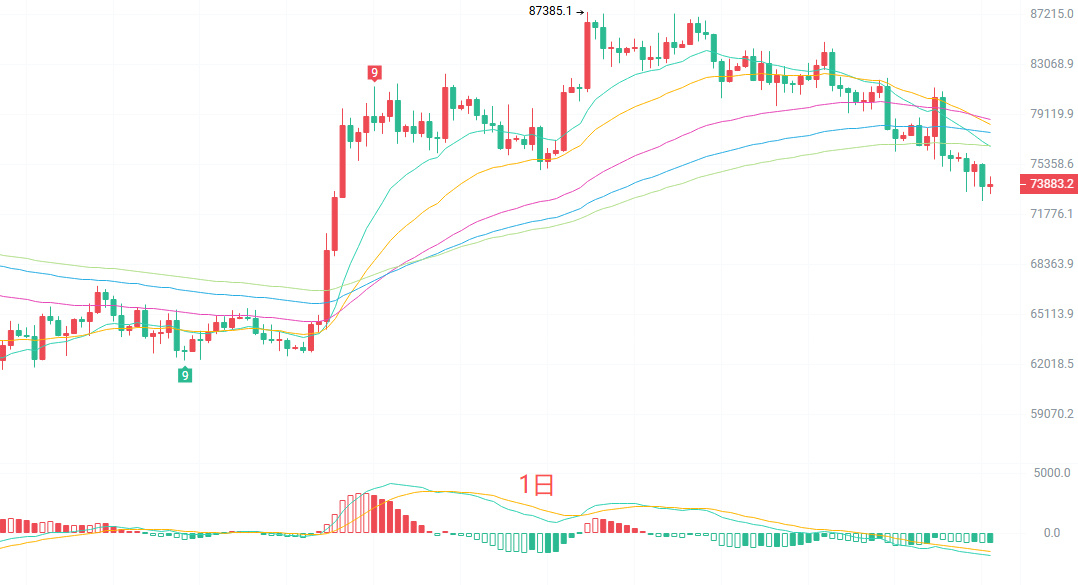
The bulls and bears on the daily chart are temporarily at a standstill here. But the structure looks ugly: at 73603, the price has fallen below all five EMA lines. They are in a full bearish alignment and spreading downward—this is a textbook downtrend. On the MACD, after a bearish cross below the zero line, the green histogram bars continue to grow, meaning downside momentum on the daily timeframe has not faded. The lower Bollinger Band at 72840 is the last floor for now. Closing above it would be a sign of strength; if it breaks, we'll need to look for the next support level.
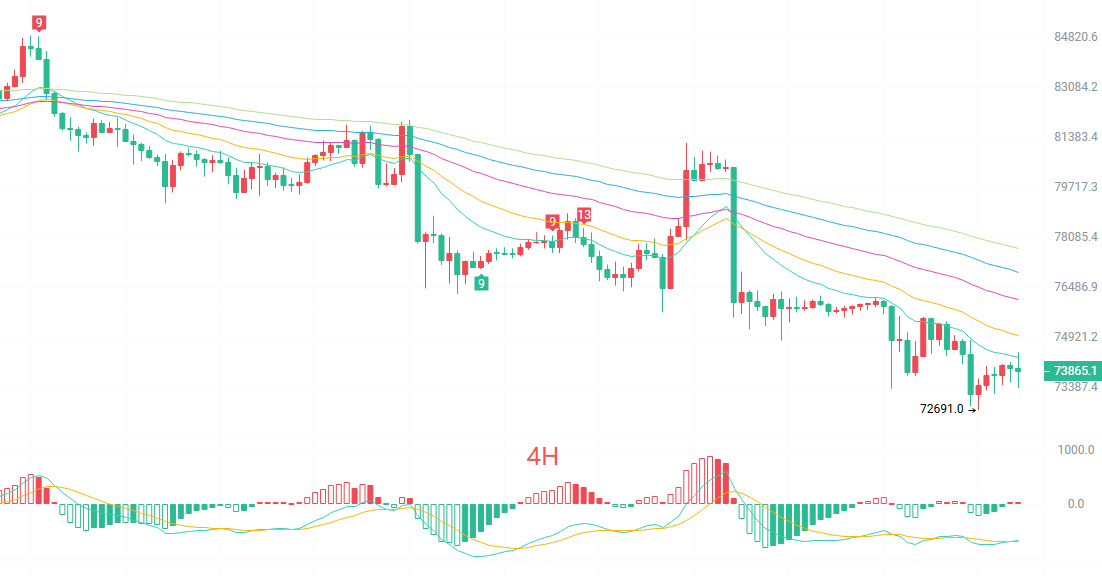
The four-hour chart is also trading below all the moving averages, with each rebound being capped at another layer. Watch for two signals in particular: First, the previous low was 72691, where yesterday's sell-off came to a halt. Today's low of 73357 did not break that previous low, showing a little short-term resilience. Second, the green MACD histogram bars are nearly gone, suggesting a possible, weakening bullish divergence at the bottom. The lower Bollinger Band is at 72859, and the price is hugging it. Usually, at this level, either the price drifts lower while forming a base, or a single high-volume bullish candle pulls it back to the middle band at 74544.
Short-term levels to watch:
Long: 72900 to 72500, if price holds; stop-loss: 500 points; target: 73800 to 74500
Short: 74800 to 75300, if upward momentum stalls; stop-loss: 500 points; target: 74000 to 73500
For specific trades, prioritize real-time order book data. For more information, feel free to contact the author. This article may be published with a delay and is for reference only. Trade at your own risk.
#BTC走势分析
While writing this, I double-checked the figures three times. Lately, a lot of people have messaged me asking, "Chen, is it okay to buy the dip now?" My answer is always the same: You can give it a try, but only use money you can afford to lose without affecting your life, and set your stop-loss in the order beforehand. The market has no shortage of "I think"; what it lacks most is "If I'm wrong, I'll get out." On this move down from 87000, how many people kept adding to their positions, then got trapped, all because they felt "it can't go any lower"? Once this bottoming process is over, whichever direction you choose, I hope you enter with a plan in hand rather than letting a single candlestick lead you around.
The bulls and bears on the daily chart are temporarily at a standstill here. But the structure looks ugly: at 73603, the price has fallen below all five EMA lines. They are in a full bearish alignment and spreading downward—this is a textbook downtrend. On the MACD, after a bearish cross below the zero line, the green histogram bars continue to grow, meaning downside momentum on the daily timeframe has not faded. The lower Bollinger Band at 72840 is the last floor for now. Closing above it would be a sign of strength; if it breaks, we'll need to look for the next support level.
The four-hour chart is also trading below all the moving averages, with each rebound being capped at another layer. Watch for two signals in particular: First, the previous low was 72691, where yesterday's sell-off came to a halt. Today's low of 73357 did not break that previous low, showing a little short-term resilience. Second, the green MACD histogram bars are nearly gone, suggesting a possible, weakening bullish divergence at the bottom. The lower Bollinger Band is at 72859, and the price is hugging it. Usually, at this level, either the price drifts lower while forming a base, or a single high-volume bullish candle pulls it back to the middle band at 74544.
Short-term levels to watch:
Long: 72900 to 72500, if price holds; stop-loss: 500 points; target: 73800 to 74500
Short: 74800 to 75300, if upward momentum stalls; stop-loss: 500 points; target: 74000 to 73500
For specific trades, prioritize real-time order book data. For more information, feel free to contact the author. This article may be published with a delay and is for reference only. Trade at your own risk.
#BTC走势分析