

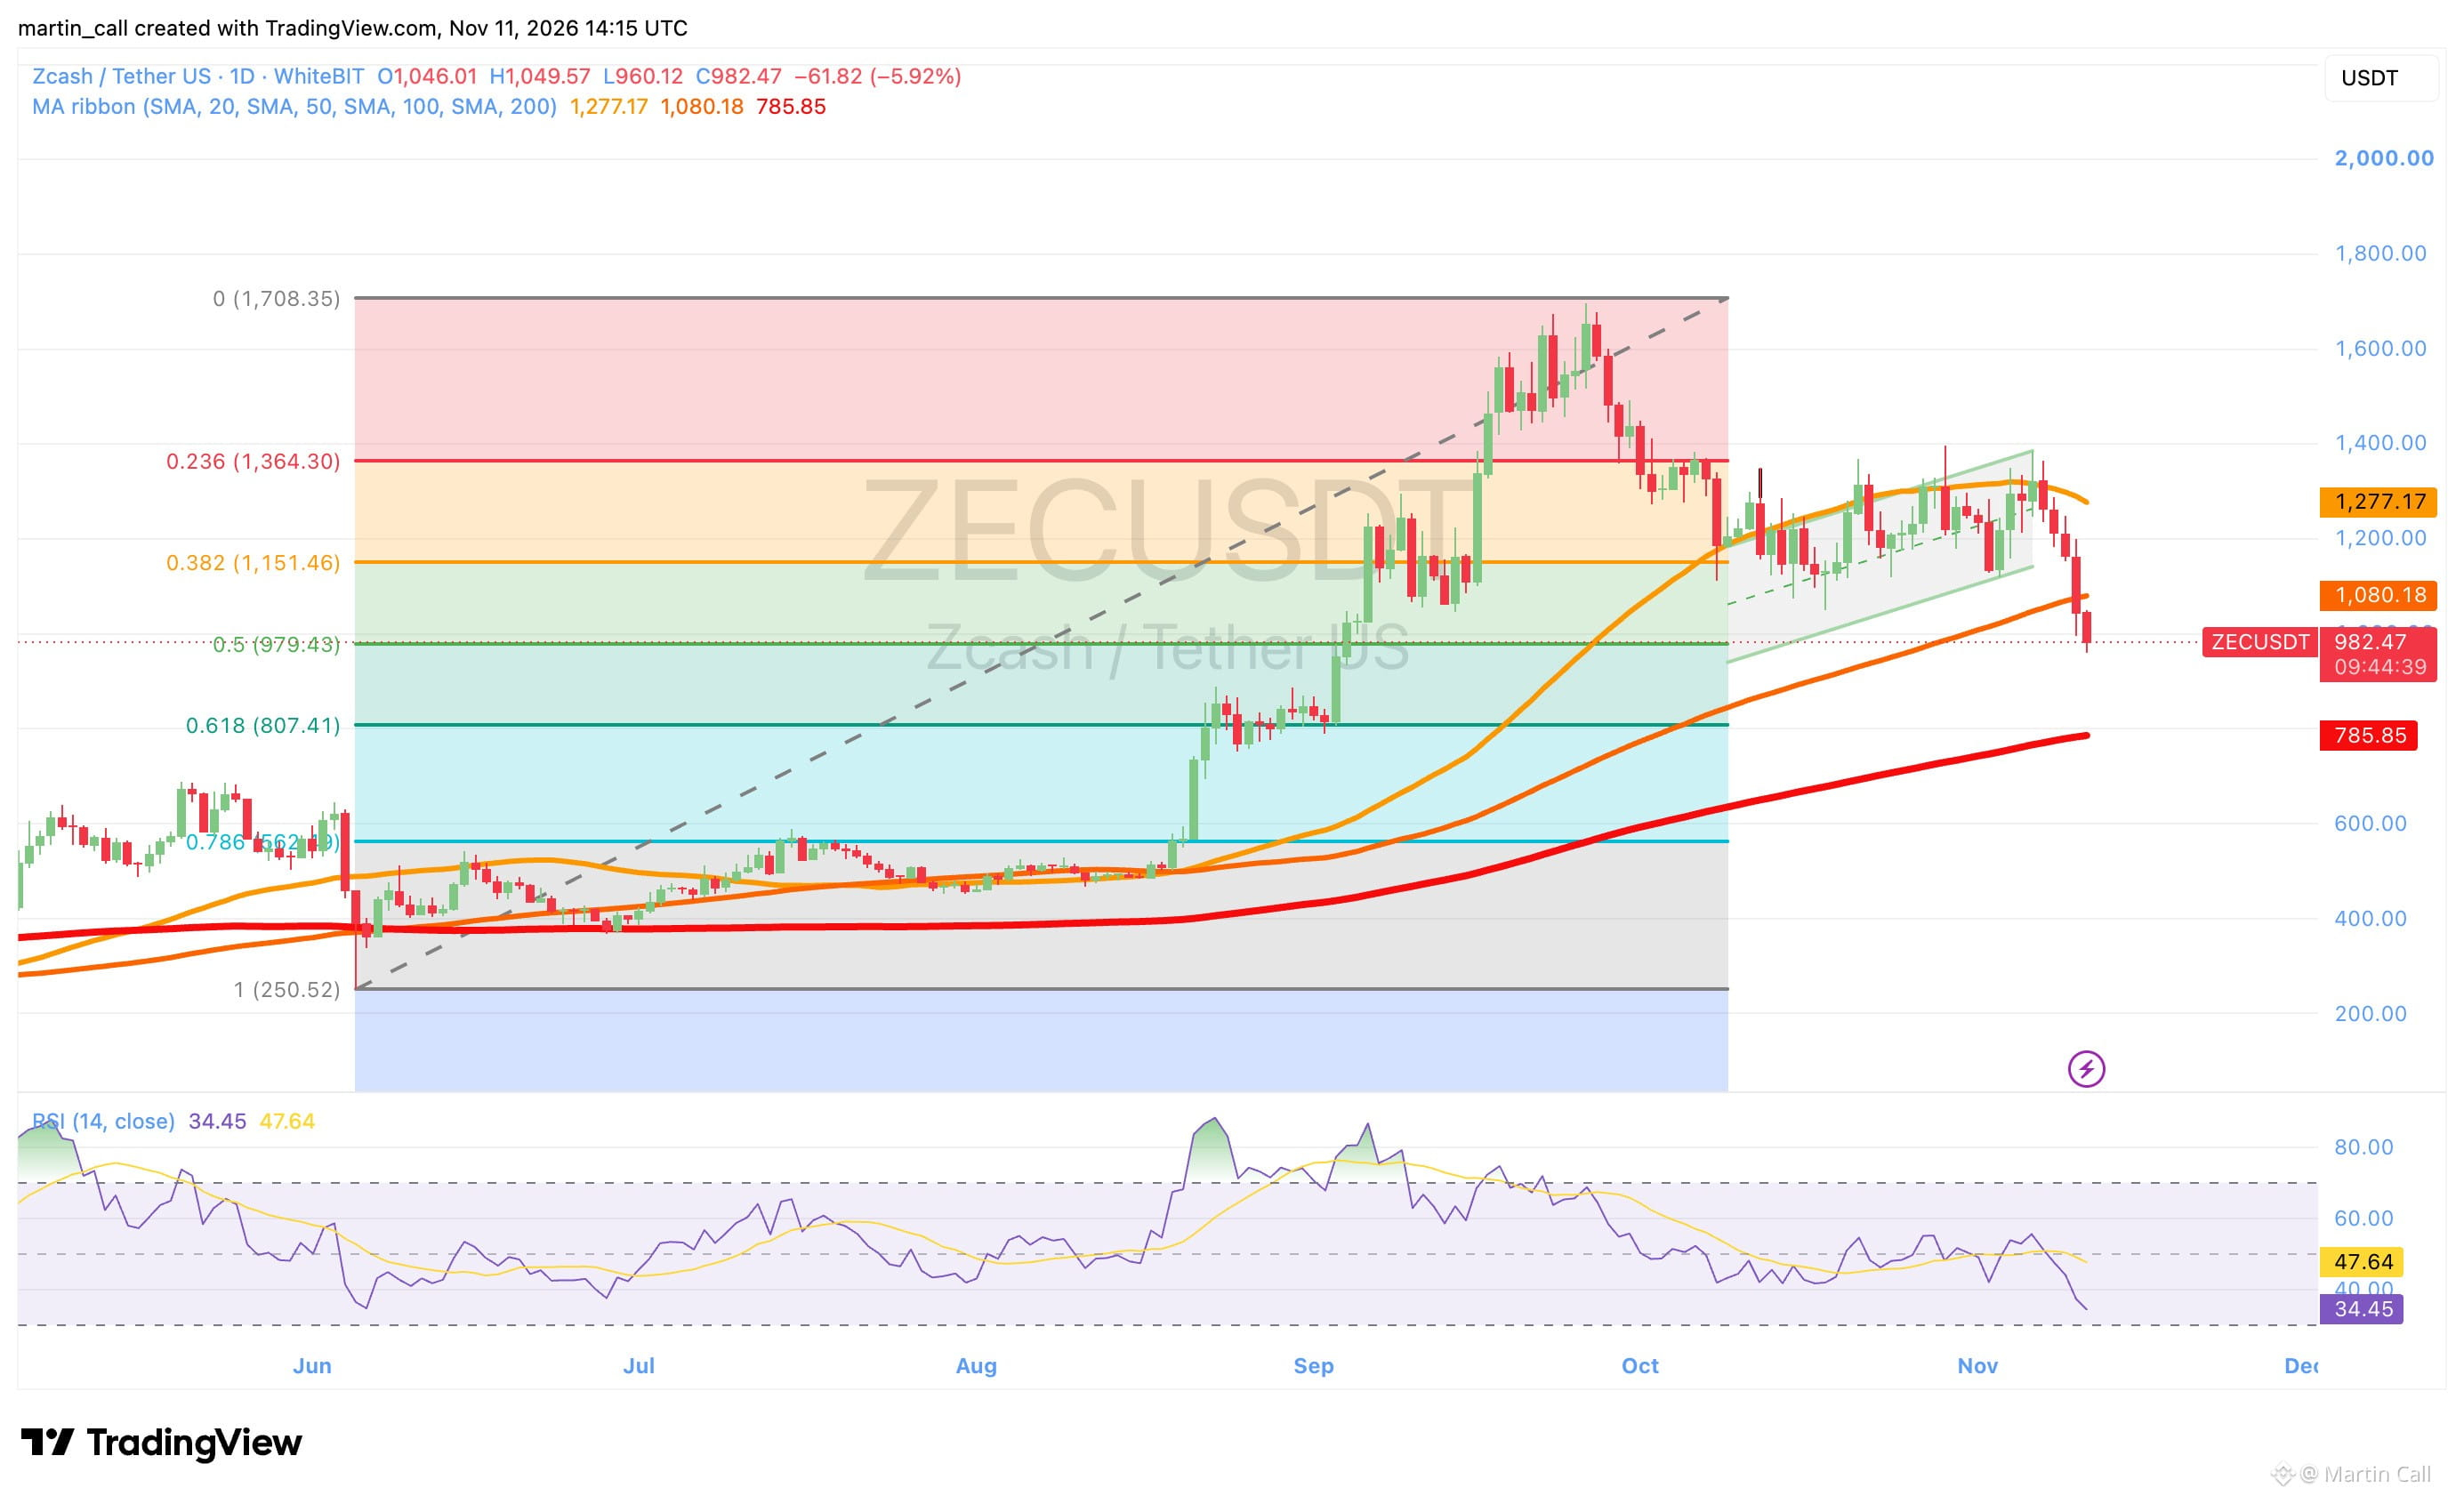
$ZEC Under $1,000 for the First Time Since September. What’s Next? 👀 #ZEC spent five weeks climbing inside a rising channel while most of the market was bleeding. Two daily candles erased all of it. Yesterday the channel broke, then the 100-day average at $1,080, and today $1,000 went too. ZEC dipped to $960 and is now back near $982. The June to September rally took ZEC from about $250 to $1,700. Half of that move sits around $979, and buyers showed up right there. RSI dropped from about 48 to 34 in two days, close to oversold but not there yet. Key levels 👇 📈 $1,080: the 100-day average, now the first ceiling. 📌 $979: the 0.5 Fibonacci level, where today’s dip got bought. 📉 $786–807: the 200-day average and the 0.618 level, right next to each other. ZEC shot from about $800 to $970 in a few days in early September and never built a base in between, so there’s not much support on the way down. A 50% pullback after a rally like this is pretty normal, and the first touch of the midpoint often gets a bounce. I’d still want ZEC back above $1,000 before calling a bottom. With $BTC under $74K after the hot CPI print, alts aren’t getting much help this week. Are you buying ZEC at the midpoint, or waiting for $800? 🤔 ❗️Not financial advice. DYOR
Join global crypto users on Binance Square
⚡️ Get latest and useful information about crypto.
💬 Trusted by the world’s largest crypto exchange.
👍 Discover real insights from verified creators.
Email / Phone number