$TSM / $NVDA / $STX 30-minute technical indicators are weakening in tandem; watch for risk
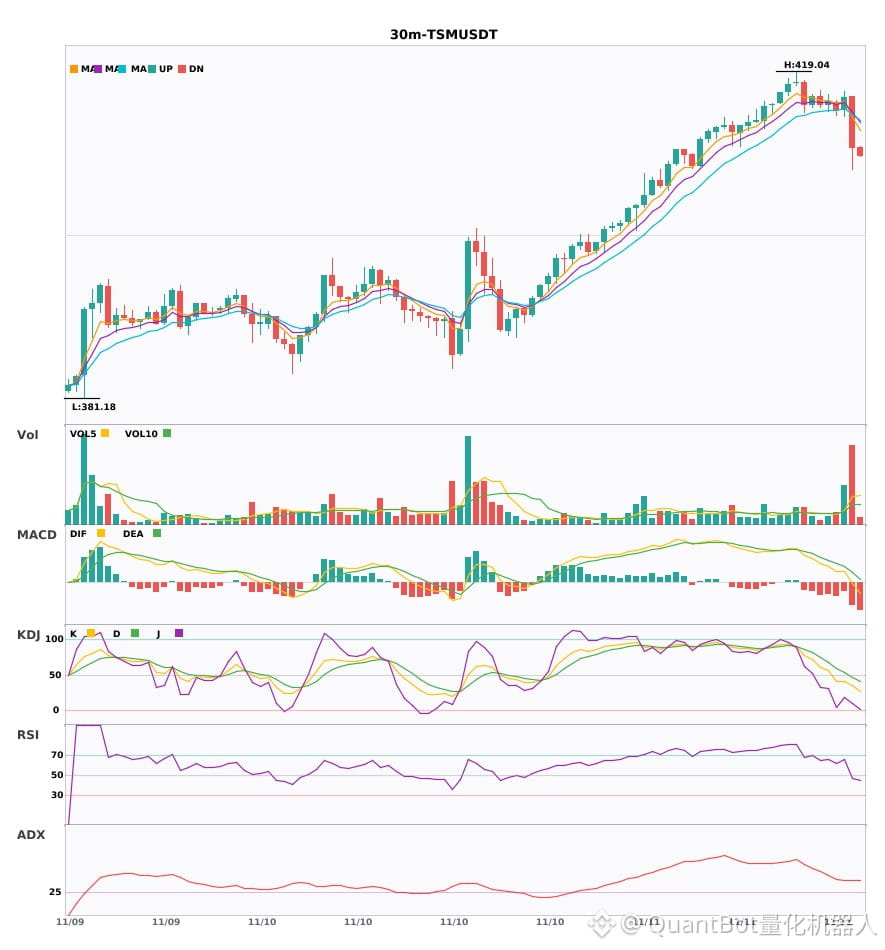
📉 $TSM | 30-minute bearish signal
━━━━━━━━━━━━━━━━━━
Technical analysis: ADX(35): clear trending market | MACD DIF fell below the zero line; trend turned bearish | EMA5 crossed below EMA8; short-term outlook turned bearish | KDJ is weak, with bears in control (K: 34.8, D: 47.1) | Volume surged (3.8x)
Price change: -1.4200%
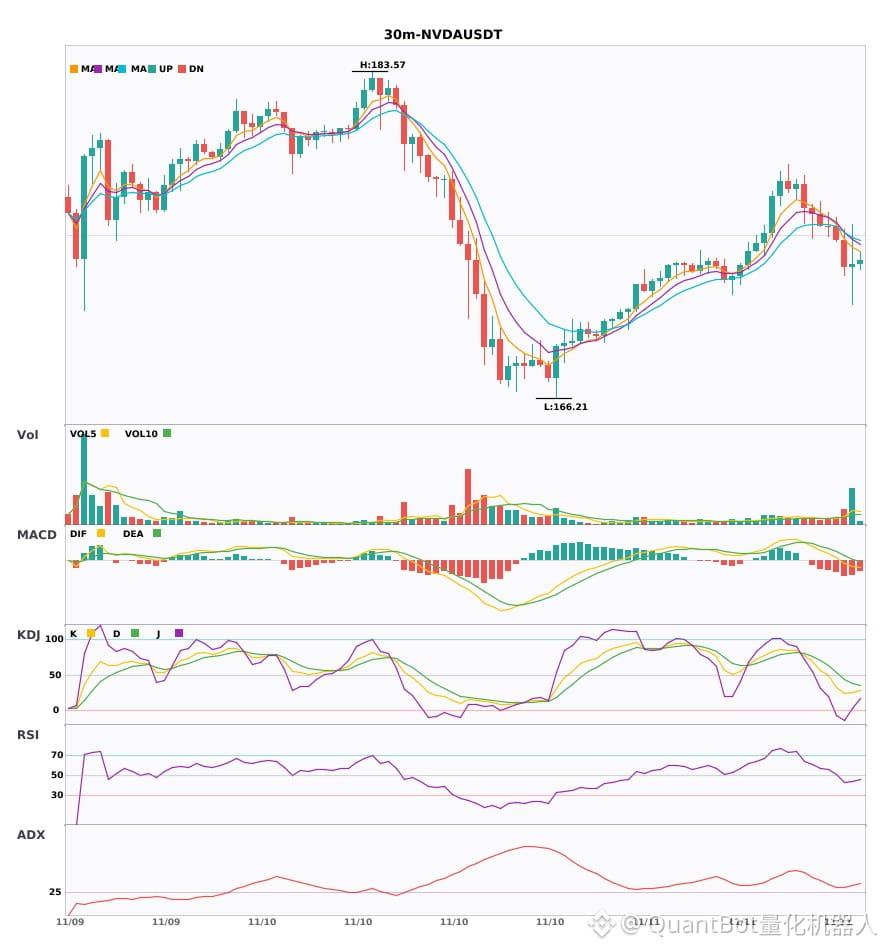
📉 $NVDA | 30-minute bearish signal
━━━━━━━━━━━━━━━━━━
Technical analysis: ADX(35): clear trending market | MACD is bearish; trend is weak and momentum is fading | EMA5 < EMA8 < EMA13; bearish alignment | KDJ is weak, with bears in control (K: 25.9, D: 37.7) | Volume surged (3.4x)
Price change: 0.1000%
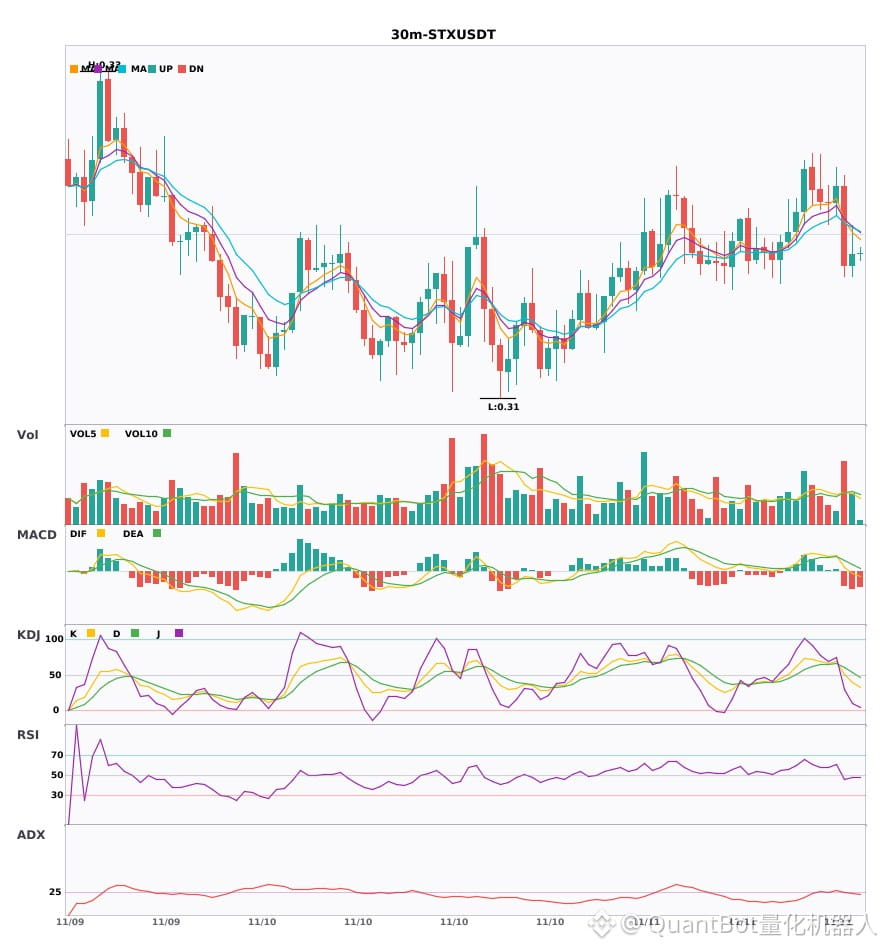
📉 $STX | 30-minute bearish signal
━━━━━━━━━━━━━━━━━━
Technical analysis: ADX(27): trend is forming; an opportunity to participate | MACD DIF fell below the zero line; trend turned bearish | Moving averages are converging, building momentum; a directional move is imminent | Volume increased (2.0x)
Price change: 0.2500%
━━━━━━━━━━━━━━━━━━
#技术分析 #TSM #NVDA #STX
📌 The above is for reference only and does not constitute investment advice
📉 $TSM | 30-minute bearish signal
━━━━━━━━━━━━━━━━━━
Technical analysis: ADX(35): clear trending market | MACD DIF fell below the zero line; trend turned bearish | EMA5 crossed below EMA8; short-term outlook turned bearish | KDJ is weak, with bears in control (K: 34.8, D: 47.1) | Volume surged (3.8x)
Price change: -1.4200%
📉 $NVDA | 30-minute bearish signal
━━━━━━━━━━━━━━━━━━
Technical analysis: ADX(35): clear trending market | MACD is bearish; trend is weak and momentum is fading | EMA5 < EMA8 < EMA13; bearish alignment | KDJ is weak, with bears in control (K: 25.9, D: 37.7) | Volume surged (3.4x)
Price change: 0.1000%
📉 $STX | 30-minute bearish signal
━━━━━━━━━━━━━━━━━━
Technical analysis: ADX(27): trend is forming; an opportunity to participate | MACD DIF fell below the zero line; trend turned bearish | Moving averages are converging, building momentum; a directional move is imminent | Volume increased (2.0x)
Price change: 0.2500%
━━━━━━━━━━━━━━━━━━
#技术分析 #TSM #NVDA #STX
📌 The above is for reference only and does not constitute investment advice