

Modeling Nvidia's (NVDA) growth trajectory and valuation metrics requires tracking its hyper-growth shift toward accelerated computing and AI data center infrastructure, alongside its valuation multiple compression as earnings catch up to its market cap.
1. Revenue Growth Trajectory Simulator
The interactive simulation model below projects Nvidia's annual revenue and valuation expansion based on starting revenue, growth rates, and time horizons.
2. Core Valuation Metrics & Multi-Year Compression
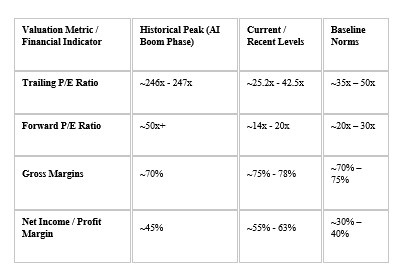
Nvidia's valuation has experienced dramatic multiple compression. While its trailing P/E ratio peaked above 240x during the initial onset of the generative AI boom when earnings lagged market pricing, rapid earnings growth has compressed the multiple toward historical large-cap tech bounds.
3. Key Drivers Shaping the Trajectory
Data Center Dominance: Data Center revenue continues to anchor the income statement (surpassing $89 billion in recent quarters), fueled by enterprise AI clusters, sovereign cloud deployments, and Blackwell architecture scale-out.
Earnings Catch-Up Effect: As highlighted by historical P/E trends, Nvidia’s explosive net income expansion has allowed the stock to compound value efficiently without requiring continuous multiple expansion.
Capacity and Supply Chain Leverage: Gross margins near 75% demonstrate exceptional pricing power, though scaling advanced packaging (TSMC nodes) remains a critical variable for sustaining high-volume growth.