

AGT has delivered an extraordinary bullish expansion, breaking out of an extended period of sideways trading and pushing price from approximately $0.0231 toward $0.0640. However, the sharp rejection following this move highlights an important development: while buyers have demonstrated significant strength, the market is now entering a highly volatile phase where profit-taking and liquidity reactions could determine the next direction.
Market Structure & Breakout Analysis
On the 1H chart, AGT spent an extended period consolidating around the $0.023–$0.024 region.
This prolonged compression was followed by an aggressive upward expansion, with price breaking away from its previous trading range and reaching a visible high of $0.064044.
The magnitude of this move represents a major shift in the short-term market structure.
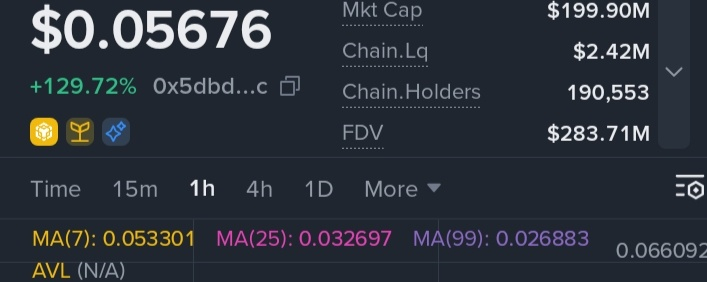
However, the subsequent sharp sell-off toward approximately $0.040 indicates that sellers are actively responding to the rally. Buyers then stepped back in, producing another strong recovery toward the current price area around $0.0567.
This recovery is encouraging, but the size of the recent price swings makes confirmation particularly important.
Moving Averages & Technical Momentum
The moving-average structure remains strongly bullish:
- MA7: $0.053301
- MA25: $0.032697
- MA99: $0.026883
- EMA7: $0.049658
- EMA25: $0.036949
- EMA99: $0.029198
Price is trading considerably above all major moving averages, reflecting the strength of the recent bullish expansion.
The separation between the short-term and longer-term averages also demonstrates how dramatically the market has moved away from its previous consolidation structure.
Nevertheless, this distance suggests that price has become significantly extended relative to its longer-term averages, increasing the possibility of volatility and corrective price action.
Important Support & Resistance Zones
The immediate resistance area is around $0.060–$0.064044.
A sustained hourly breakout above the recent high of $0.064044, followed by a successful retest, would provide stronger evidence that buyers are preparing for another expansion.
On the downside, I am monitoring several important areas:
- $0.0533–$0.0540: Immediate support around the MA7 and recent price structure.
- $0.0480–$0.0497: Important secondary support around the EMA7 and visible chart region.
- $0.0390–$0.0400: Major short-term reaction area following the recent sell-off.
- $0.0327–$0.0370: Broader moving-average support region.
- $0.0231–$0.0240: Previous consolidation base and origin of the major expansion.
These are potential reaction zones, not guaranteed support levels.
Potential Market Scenarios
Bullish Scenario: If AGT maintains acceptance above $0.0533 and buyers regain control around $0.060, another attempt toward $0.064044 becomes possible. A confirmed breakout above the previous high could open the way for further price discovery.
Bearish Scenario: If the current recovery loses strength and price breaks below $0.0480, selling pressure could increase toward $0.0390–$0.0400. Losing that region would significantly weaken the current recovery structure.
Consolidation Scenario: AGT could establish a wider trading range between approximately $0.048 and $0.064 while the market absorbs the recent explosive move. Such consolidation would not automatically invalidate the bullish structure.
Risk Management & My Perspective
Personally, I would be extremely careful about chasing AGT after such an aggressive rally.
The recent movement has created substantial distance between price and the longer-term moving averages. Entering without a confirmed structure could expose traders to considerable downside volatility.
I would prefer to see either a controlled pullback toward support followed by a convincing bullish reaction, or a confirmed breakout above $0.064044 with a successful retest.
For risk management, the invalidation level should be determined by the actual entry structure. A sustained breakdown below $0.0390–$0.0400 would seriously damage the current bullish recovery thesis.
Final Thoughts
My short-term outlook on AGT remains bullish, but with elevated caution.
The breakout from the $0.023 region demonstrates considerable buying strength, and the latest recovery shows that buyers have not completely surrendered control after the sharp correction.
However, a 129% rally also creates conditions where volatility and profit-taking can become significant.
I am more interested in whether AGT can establish a sustainable base above $0.0533 than in chasing another immediate upward candle.
The big question: Is AGT preparing for a confirmed breakout above $0.064, potentially entering another expansion phase, or will the market need a deeper correction before buyers can regain momentum?
I would be interested to hear how other traders are approaching this high-volatility setup.