A mismatch showed up in the overnight session—the weekly chart is still green, but rent has already turned into a subsidy. The ledger doesn’t look like shorts are giving up: more seats are being added, and coin-margined money is still flowing in.
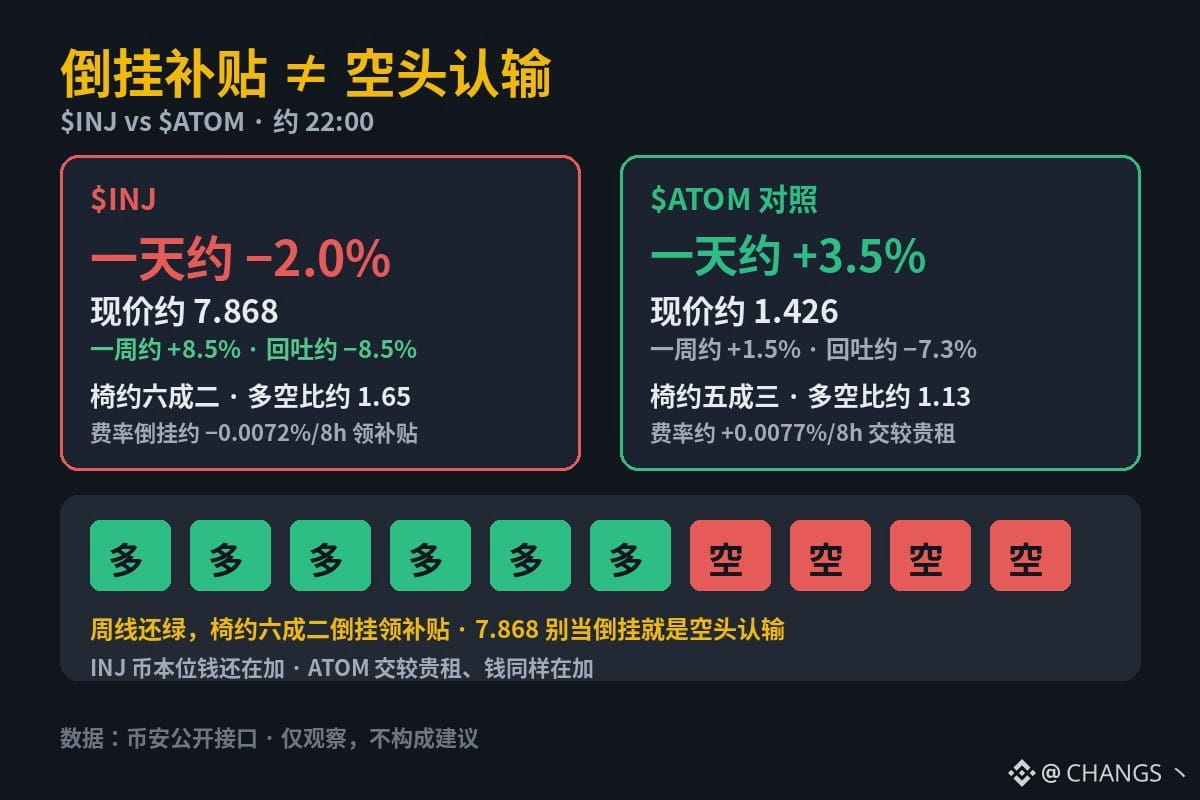
$INJ: down about 2.0% in a day / up about 8.5% in a week, currently around 7.868. Weekly high around 8.598, giving back about 8.5%. Account long/short ratio around 1.65 (about 62% long; around 1.43 / 59% long about a day ago, so seats are being added). Funding is inverted at around −0.0072%/8h, paying a subsidy; coin-margined OI is up around 2.9% over the past day (U-margined OI is nearly unchanged). Price has slid from the intraday high around 8.444, while the weekly chart is still green, seats are being added, inverted funding is paying a subsidy, and coin-margined money is still flowing in—don’t take the subsidy at 7.868 as proof that shorts have given up, and definitely don’t take the still-green weekly chart as proof the correction is over.
In the same arena, $ATOM is up around 3.5% in a day and around 1.5% in a week, currently around 1.426. Weekly high around 1.538, giving back about 7.3%. Seats are around 53% long (long/short ratio around 1.13; around 1.03 / 51% long about a day ago, so seats have edged up). Funding is around +0.0077%/8h, paying a higher rent, and OI is up around 3.1%. Price is turning around, the drawdown is shallower, seats aren’t crowded and have edged up, but traders are paying higher rent, and money is still flowing in.
On one side, the weekly chart is still green, inverted funding is paying a subsidy, seats are being added, and money hasn’t pulled out. On the other, Cosmos in the same arena is turning around, paying higher rent, and money is also flowing in. Is this shorts giving up, or is the weekly chart still green and the seats still not cleared out? Drop a counterexample in the comments.
$INJ: down about 2.0% in a day / up about 8.5% in a week, currently around 7.868. Weekly high around 8.598, giving back about 8.5%. Account long/short ratio around 1.65 (about 62% long; around 1.43 / 59% long about a day ago, so seats are being added). Funding is inverted at around −0.0072%/8h, paying a subsidy; coin-margined OI is up around 2.9% over the past day (U-margined OI is nearly unchanged). Price has slid from the intraday high around 8.444, while the weekly chart is still green, seats are being added, inverted funding is paying a subsidy, and coin-margined money is still flowing in—don’t take the subsidy at 7.868 as proof that shorts have given up, and definitely don’t take the still-green weekly chart as proof the correction is over.
In the same arena, $ATOM is up around 3.5% in a day and around 1.5% in a week, currently around 1.426. Weekly high around 1.538, giving back about 7.3%. Seats are around 53% long (long/short ratio around 1.13; around 1.03 / 51% long about a day ago, so seats have edged up). Funding is around +0.0077%/8h, paying a higher rent, and OI is up around 3.1%. Price is turning around, the drawdown is shallower, seats aren’t crowded and have edged up, but traders are paying higher rent, and money is still flowing in.
On one side, the weekly chart is still green, inverted funding is paying a subsidy, seats are being added, and money hasn’t pulled out. On the other, Cosmos in the same arena is turning around, paying higher rent, and money is also flowing in. Is this shorts giving up, or is the weekly chart still green and the seats still not cleared out? Drop a counterexample in the comments.