Where is $NEAR 's money going? 🤔
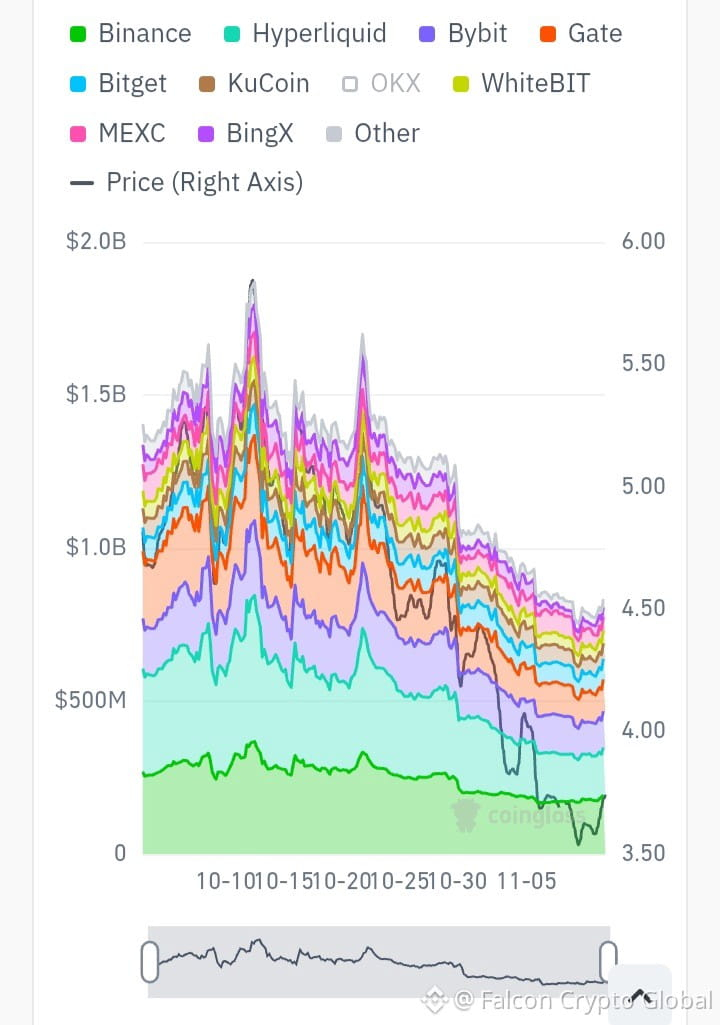
Look at this Open Interest (OI) chart for NEAR:
· Total OI: Dropped heavily from over $2.0B to the $500M-$700M zone.
· The Trend: A massive decline across all platforms. Big players are closing their positions.
What does this mean?
When OI and Price drop together, it means leverage is leaving the NEAR market. Traders are avoiding new risk right now.
What do you think? When will liquidity return to NEAR? 👇
#HotCPIDecemberHikePriced #AnthropicRejectsIPODelayValuationinQuestion #NEARUSDT #AlSyedTrader
Look at this Open Interest (OI) chart for NEAR:
· Total OI: Dropped heavily from over $2.0B to the $500M-$700M zone.
· The Trend: A massive decline across all platforms. Big players are closing their positions.
What does this mean?
When OI and Price drop together, it means leverage is leaving the NEAR market. Traders are avoiding new risk right now.
What do you think? When will liquidity return to NEAR? 👇
#HotCPIDecemberHikePriced #AnthropicRejectsIPODelayValuationinQuestion #NEARUSDT #AlSyedTrader