$SXT 🧱 STX/USDT (Stacks)
Current Price: ~0.3221 USDT
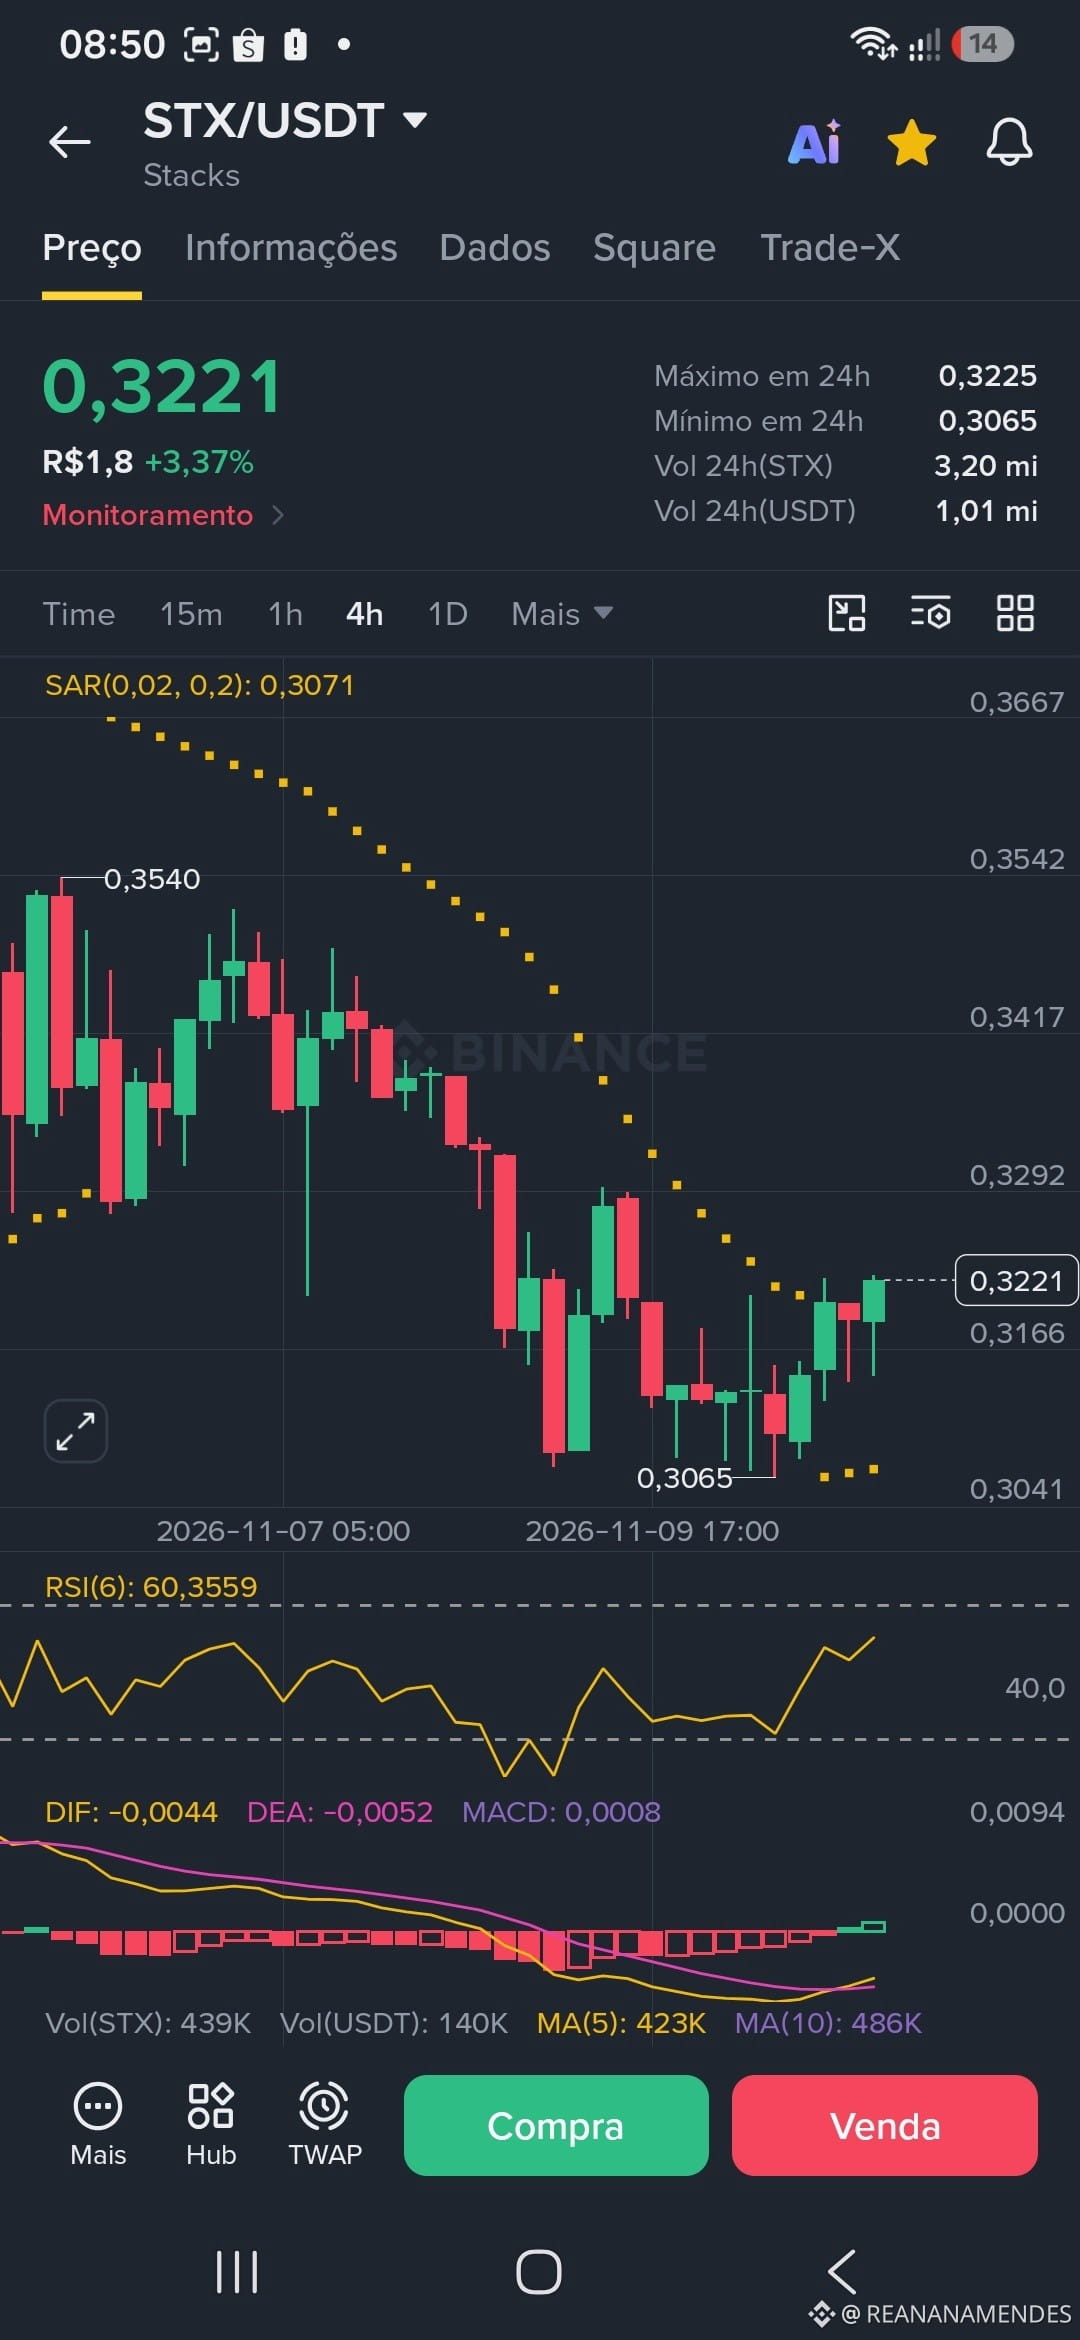
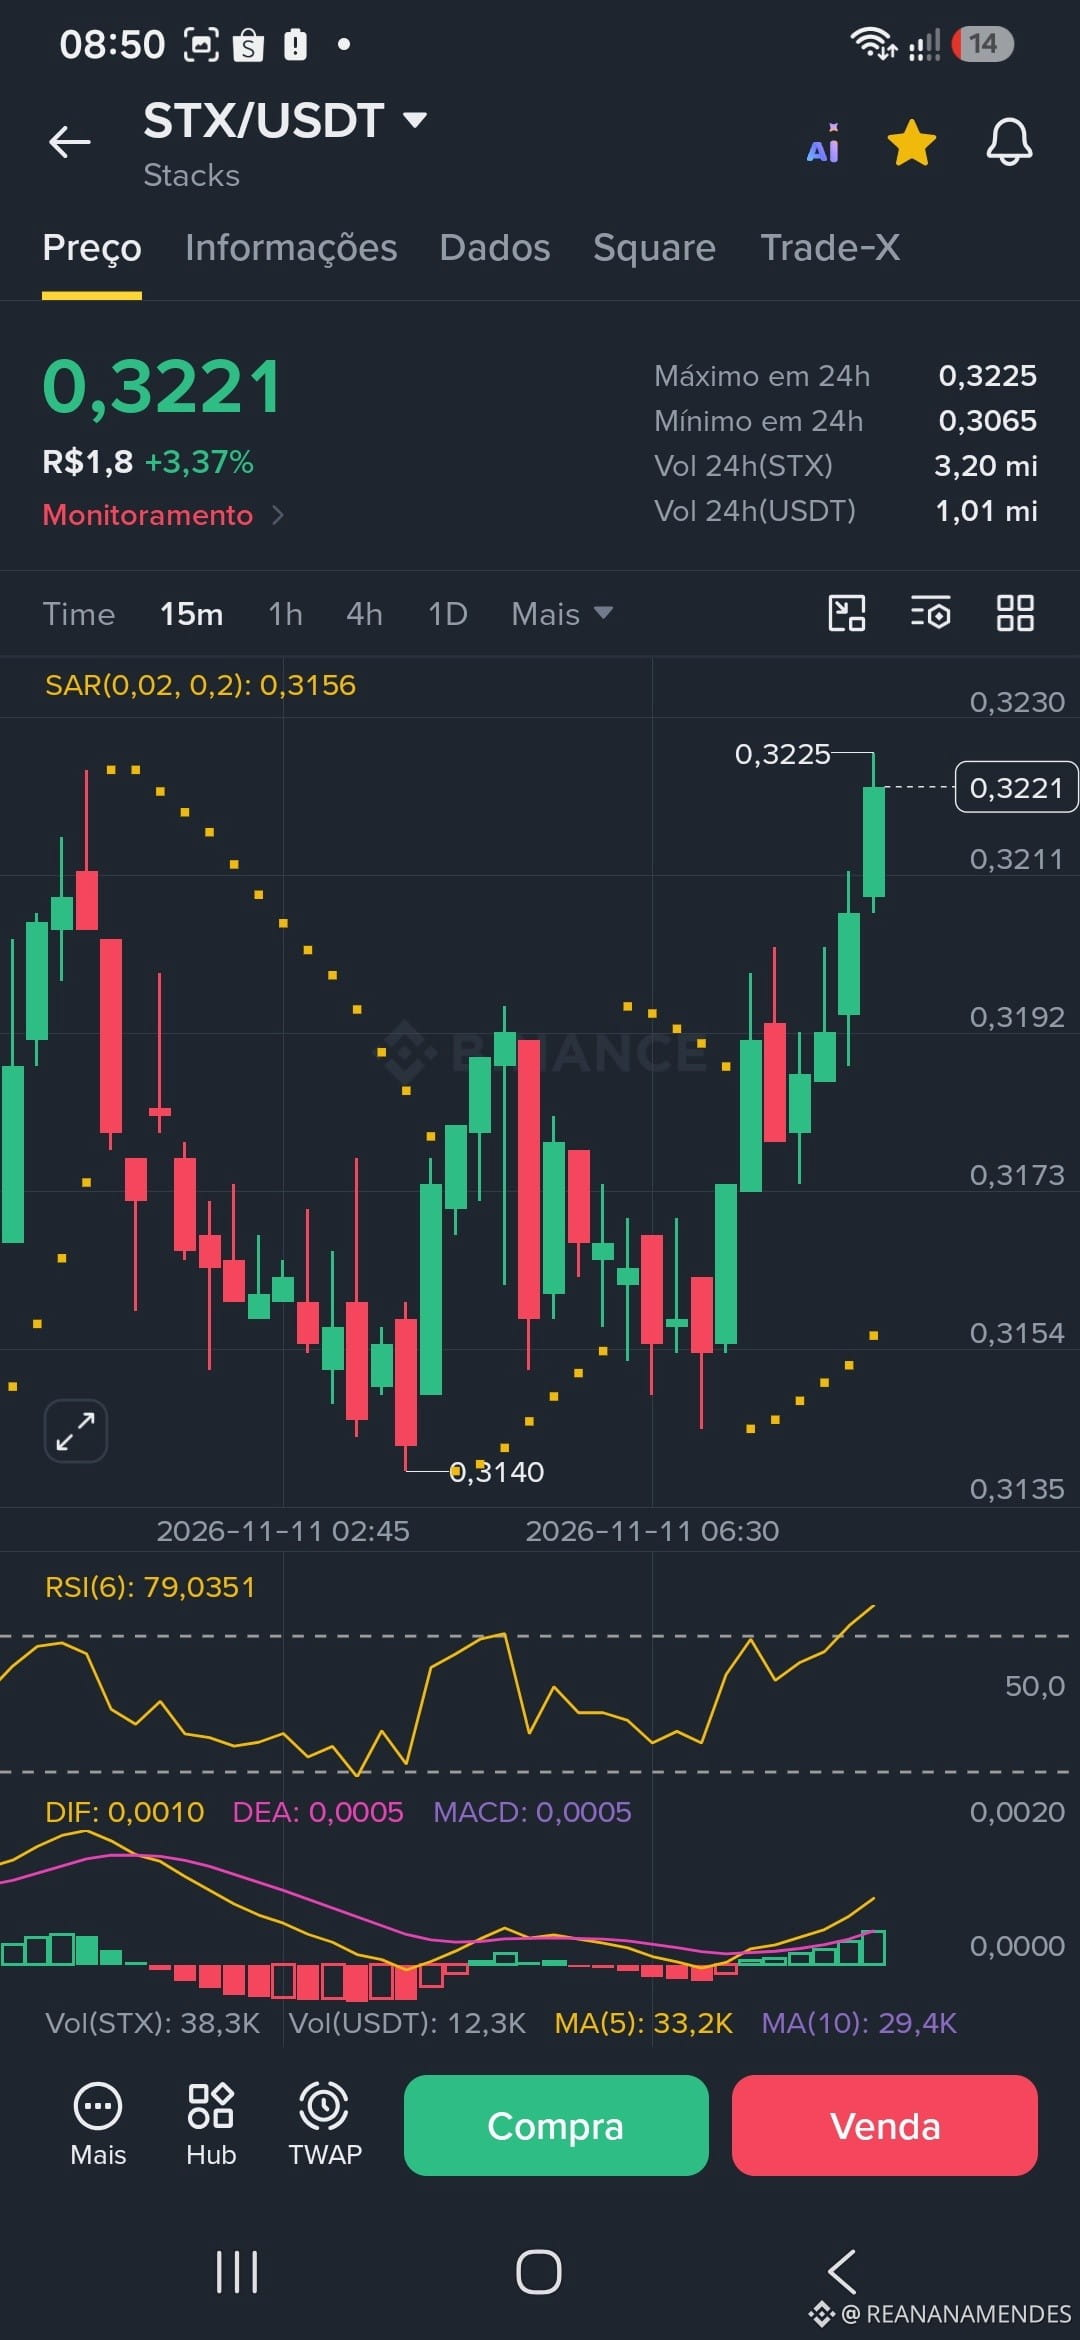
Technical Analysis (4h / 15m): On the 4-hour chart, STX found a bottom near 0.3065 and is trying to reverse its previous downtrend, with the Parabolic SAR moving below the price on shorter timeframes. On the 15m chart, the RSI reached more extended levels near 79 and is now correcting slightly, while the MACD shows a positive crossover with modest green bars.
Trader's View: Exercise caution when entering at market due to the short-term RSI stretch. Ideally, wait for a healthy pullback to test nearby support levels before re-entering with a long position at a better risk/reward ratio.
Current Price: ~0.3221 USDT
Technical Analysis (4h / 15m): On the 4-hour chart, STX found a bottom near 0.3065 and is trying to reverse its previous downtrend, with the Parabolic SAR moving below the price on shorter timeframes. On the 15m chart, the RSI reached more extended levels near 79 and is now correcting slightly, while the MACD shows a positive crossover with modest green bars.
Trader's View: Exercise caution when entering at market due to the short-term RSI stretch. Ideally, wait for a healthy pullback to test nearby support levels before re-entering with a long position at a better risk/reward ratio.