📉 BITCOIN ANALYSIS: IS BTC FORMING A BOTTOM OR JUST EXPERIENCING A TECHNICAL BOUNCE?
$MASK Coin, $BTC
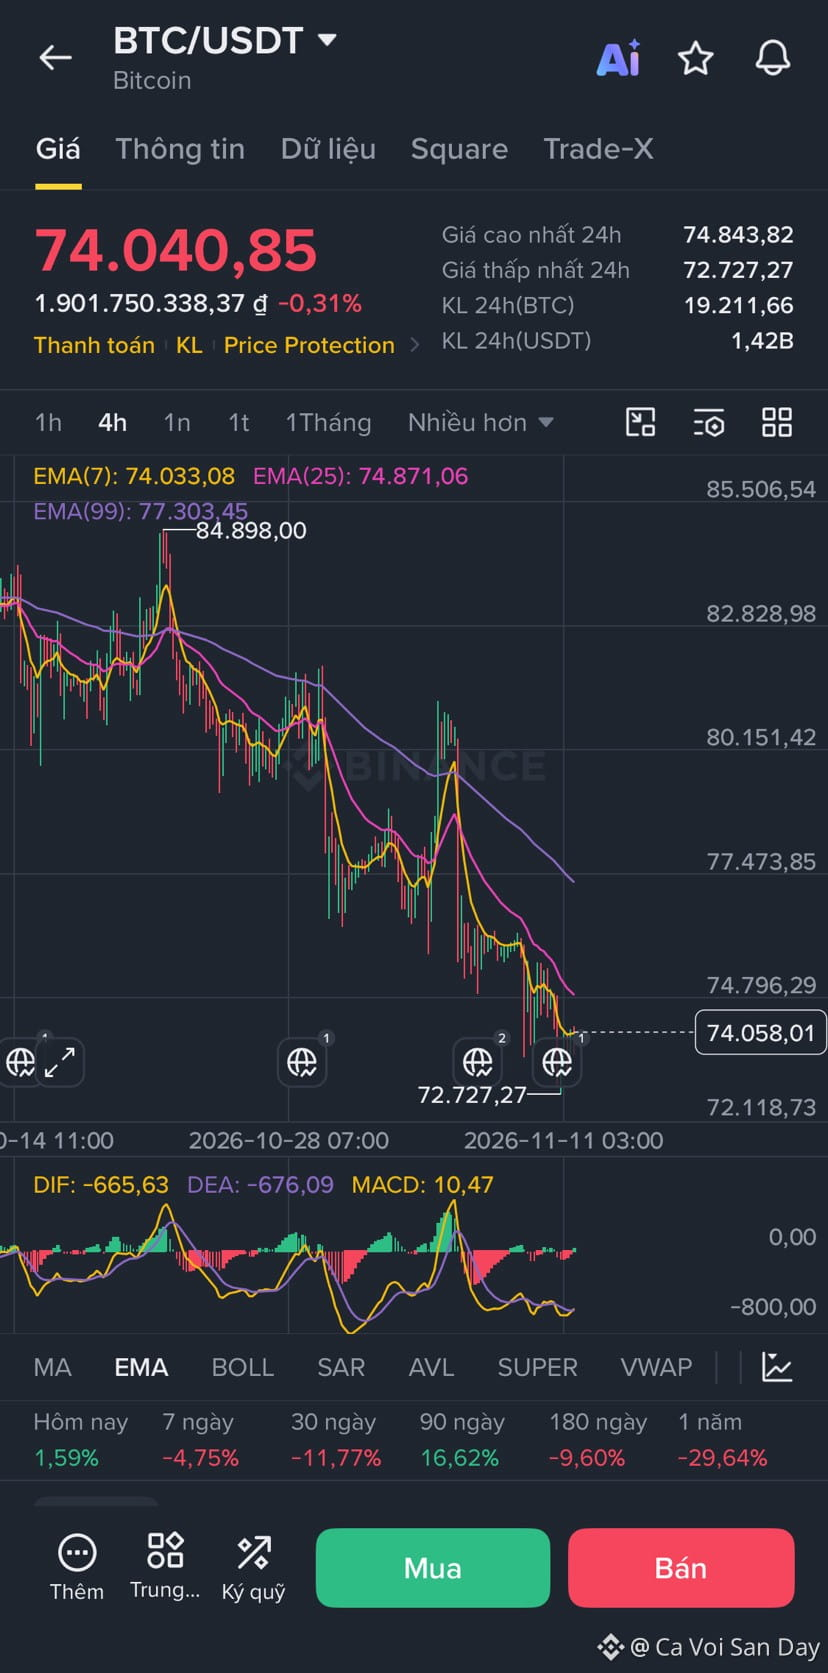
Based on the BTC/USDT 4H chart on Binance:
📊 1. Price trend
* BTC price: around 74,040 USD.
* 24H high: 74,843 USD.
* 24H low: 72,727 USD.
* The price has fallen about 4.75% in 7 days and 11.77% in 30 days.
📉 2. EMA analysis
* EMA7: 74,033 USD – the price is tracking closely along this line.
* EMA25: 74,871 USD – nearby resistance.
* EMA99: 77,303 USD – further resistance.
The price remains below EMA25 and EMA99, indicating that the downtrend has not been broken.
📈 3. MACD
MACD is in negative territory, but DIF and DEA are showing signs of converging. This could signal weakening selling pressure; however, it is not yet enough to confirm a reversal.
🎯 4. Price levels to watch
* Nearby support: 72,700–72,100 USD.
* Nearby resistance: 74,800–75,000 USD.
* Next resistance: 77,300 USD.
🐋 Ca Voi San Day’s perspective:
If BTC breaks above 75,000 USD and holds, the recovery outlook will improve. Conversely, if it falls below 72,700 USD, selling pressure could continue to increase.
Do you think BTC will recover to 77K or continue falling toward 70K?
⚠️ This is a technical analysis based on the chart at the time it was captured, not a guaranteed buy or sell signal. Manage your capital and limit leverage.
#Bitcoin #BTC #TechnicalAnalysis #Crypto #CaVoiSanDay
$MASK Coin, $BTC
Based on the BTC/USDT 4H chart on Binance:
📊 1. Price trend
* BTC price: around 74,040 USD.
* 24H high: 74,843 USD.
* 24H low: 72,727 USD.
* The price has fallen about 4.75% in 7 days and 11.77% in 30 days.
📉 2. EMA analysis
* EMA7: 74,033 USD – the price is tracking closely along this line.
* EMA25: 74,871 USD – nearby resistance.
* EMA99: 77,303 USD – further resistance.
The price remains below EMA25 and EMA99, indicating that the downtrend has not been broken.
📈 3. MACD
MACD is in negative territory, but DIF and DEA are showing signs of converging. This could signal weakening selling pressure; however, it is not yet enough to confirm a reversal.
🎯 4. Price levels to watch
* Nearby support: 72,700–72,100 USD.
* Nearby resistance: 74,800–75,000 USD.
* Next resistance: 77,300 USD.
🐋 Ca Voi San Day’s perspective:
If BTC breaks above 75,000 USD and holds, the recovery outlook will improve. Conversely, if it falls below 72,700 USD, selling pressure could continue to increase.
Do you think BTC will recover to 77K or continue falling toward 70K?
⚠️ This is a technical analysis based on the chart at the time it was captured, not a guaranteed buy or sell signal. Manage your capital and limit leverage.
#Bitcoin #BTC #TechnicalAnalysis #Crypto #CaVoiSanDay