$ZAMA: Volume Illusion and the Anchoring Trap
The hourly chart for $ZAMA shows direction up while volume stays above baseline. Does this pattern tempt us to read hidden strength into a normal swing?
Over‑interpreting routine volume changes often triggers the anchoring bias. When a trader first notices a modest rise in volume, that initial impression can become a mental anchor that colors later judgments. Even if subsequent candles revert to average activity, the early signal may still dominate the narrative, leading to an overconfident belief in a sustained move.
Imagine a trader who interprets the current volume as evidence of a large buyer stepping in. The trader may then allocate more capital, fearing a missed opportunity if the price later reverses. This reaction illustrates loss aversion combined with anchoring: the perceived cost of staying out feels larger than the actual risk of a small pullback.
A counterexample helps illustrate the limit of this reasoning. If the next hourly bar shows direction down and volume returning to typical levels, the initial anchor loses relevance and the price may settle near the recent support 0.06271. The earlier volume spike does not guarantee a lasting trend.
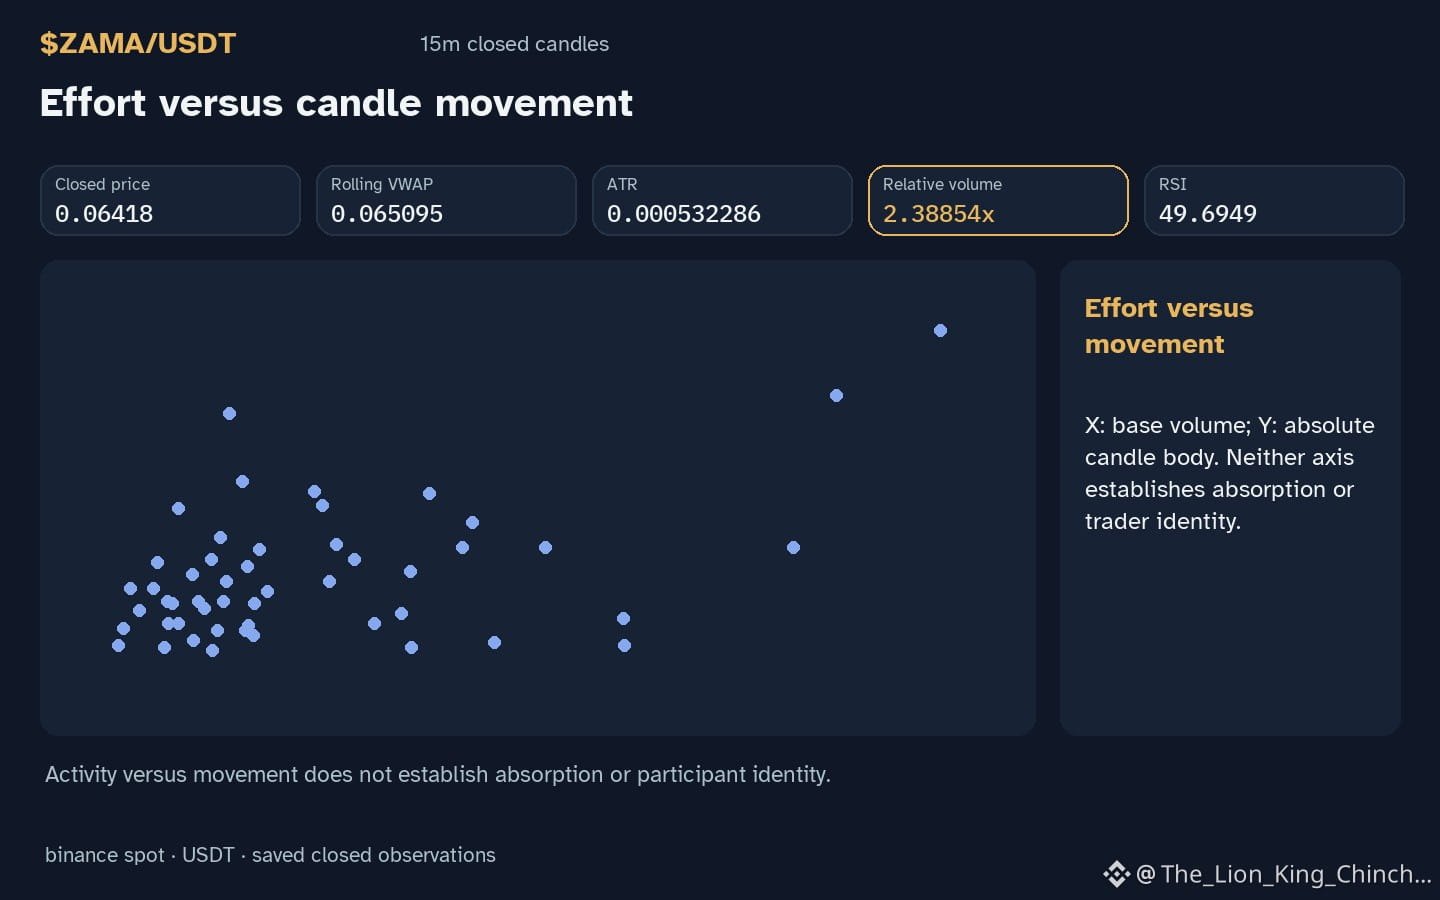
Practical self‑check: before acting on a volume spike, pause and ask whether the observation adds new information or merely repeats a familiar pattern. Compare the current relative volume 2.38854 with the longer‑term average and note if the price has moved beyond the recent resistance 0.0652. If the answer is no, consider treating the signal as noise rather than a decisive cue. This simple habit can reduce the pull of anchoring and protect against unnecessary exposure.
Probabilistic market research, not a recommendation or guaranteed return.
New evidence or a familiar bias?
#ZAMA
The hourly chart for $ZAMA shows direction up while volume stays above baseline. Does this pattern tempt us to read hidden strength into a normal swing?
Over‑interpreting routine volume changes often triggers the anchoring bias. When a trader first notices a modest rise in volume, that initial impression can become a mental anchor that colors later judgments. Even if subsequent candles revert to average activity, the early signal may still dominate the narrative, leading to an overconfident belief in a sustained move.
Imagine a trader who interprets the current volume as evidence of a large buyer stepping in. The trader may then allocate more capital, fearing a missed opportunity if the price later reverses. This reaction illustrates loss aversion combined with anchoring: the perceived cost of staying out feels larger than the actual risk of a small pullback.
A counterexample helps illustrate the limit of this reasoning. If the next hourly bar shows direction down and volume returning to typical levels, the initial anchor loses relevance and the price may settle near the recent support 0.06271. The earlier volume spike does not guarantee a lasting trend.
Practical self‑check: before acting on a volume spike, pause and ask whether the observation adds new information or merely repeats a familiar pattern. Compare the current relative volume 2.38854 with the longer‑term average and note if the price has moved beyond the recent resistance 0.0652. If the answer is no, consider treating the signal as noise rather than a decisive cue. This simple habit can reduce the pull of anchoring and protect against unnecessary exposure.
Probabilistic market research, not a recommendation or guaranteed return.
New evidence or a familiar bias?
#ZAMA