Accumulation or distribution? Rebound or reversal? Confusing these four terms costs you the most!
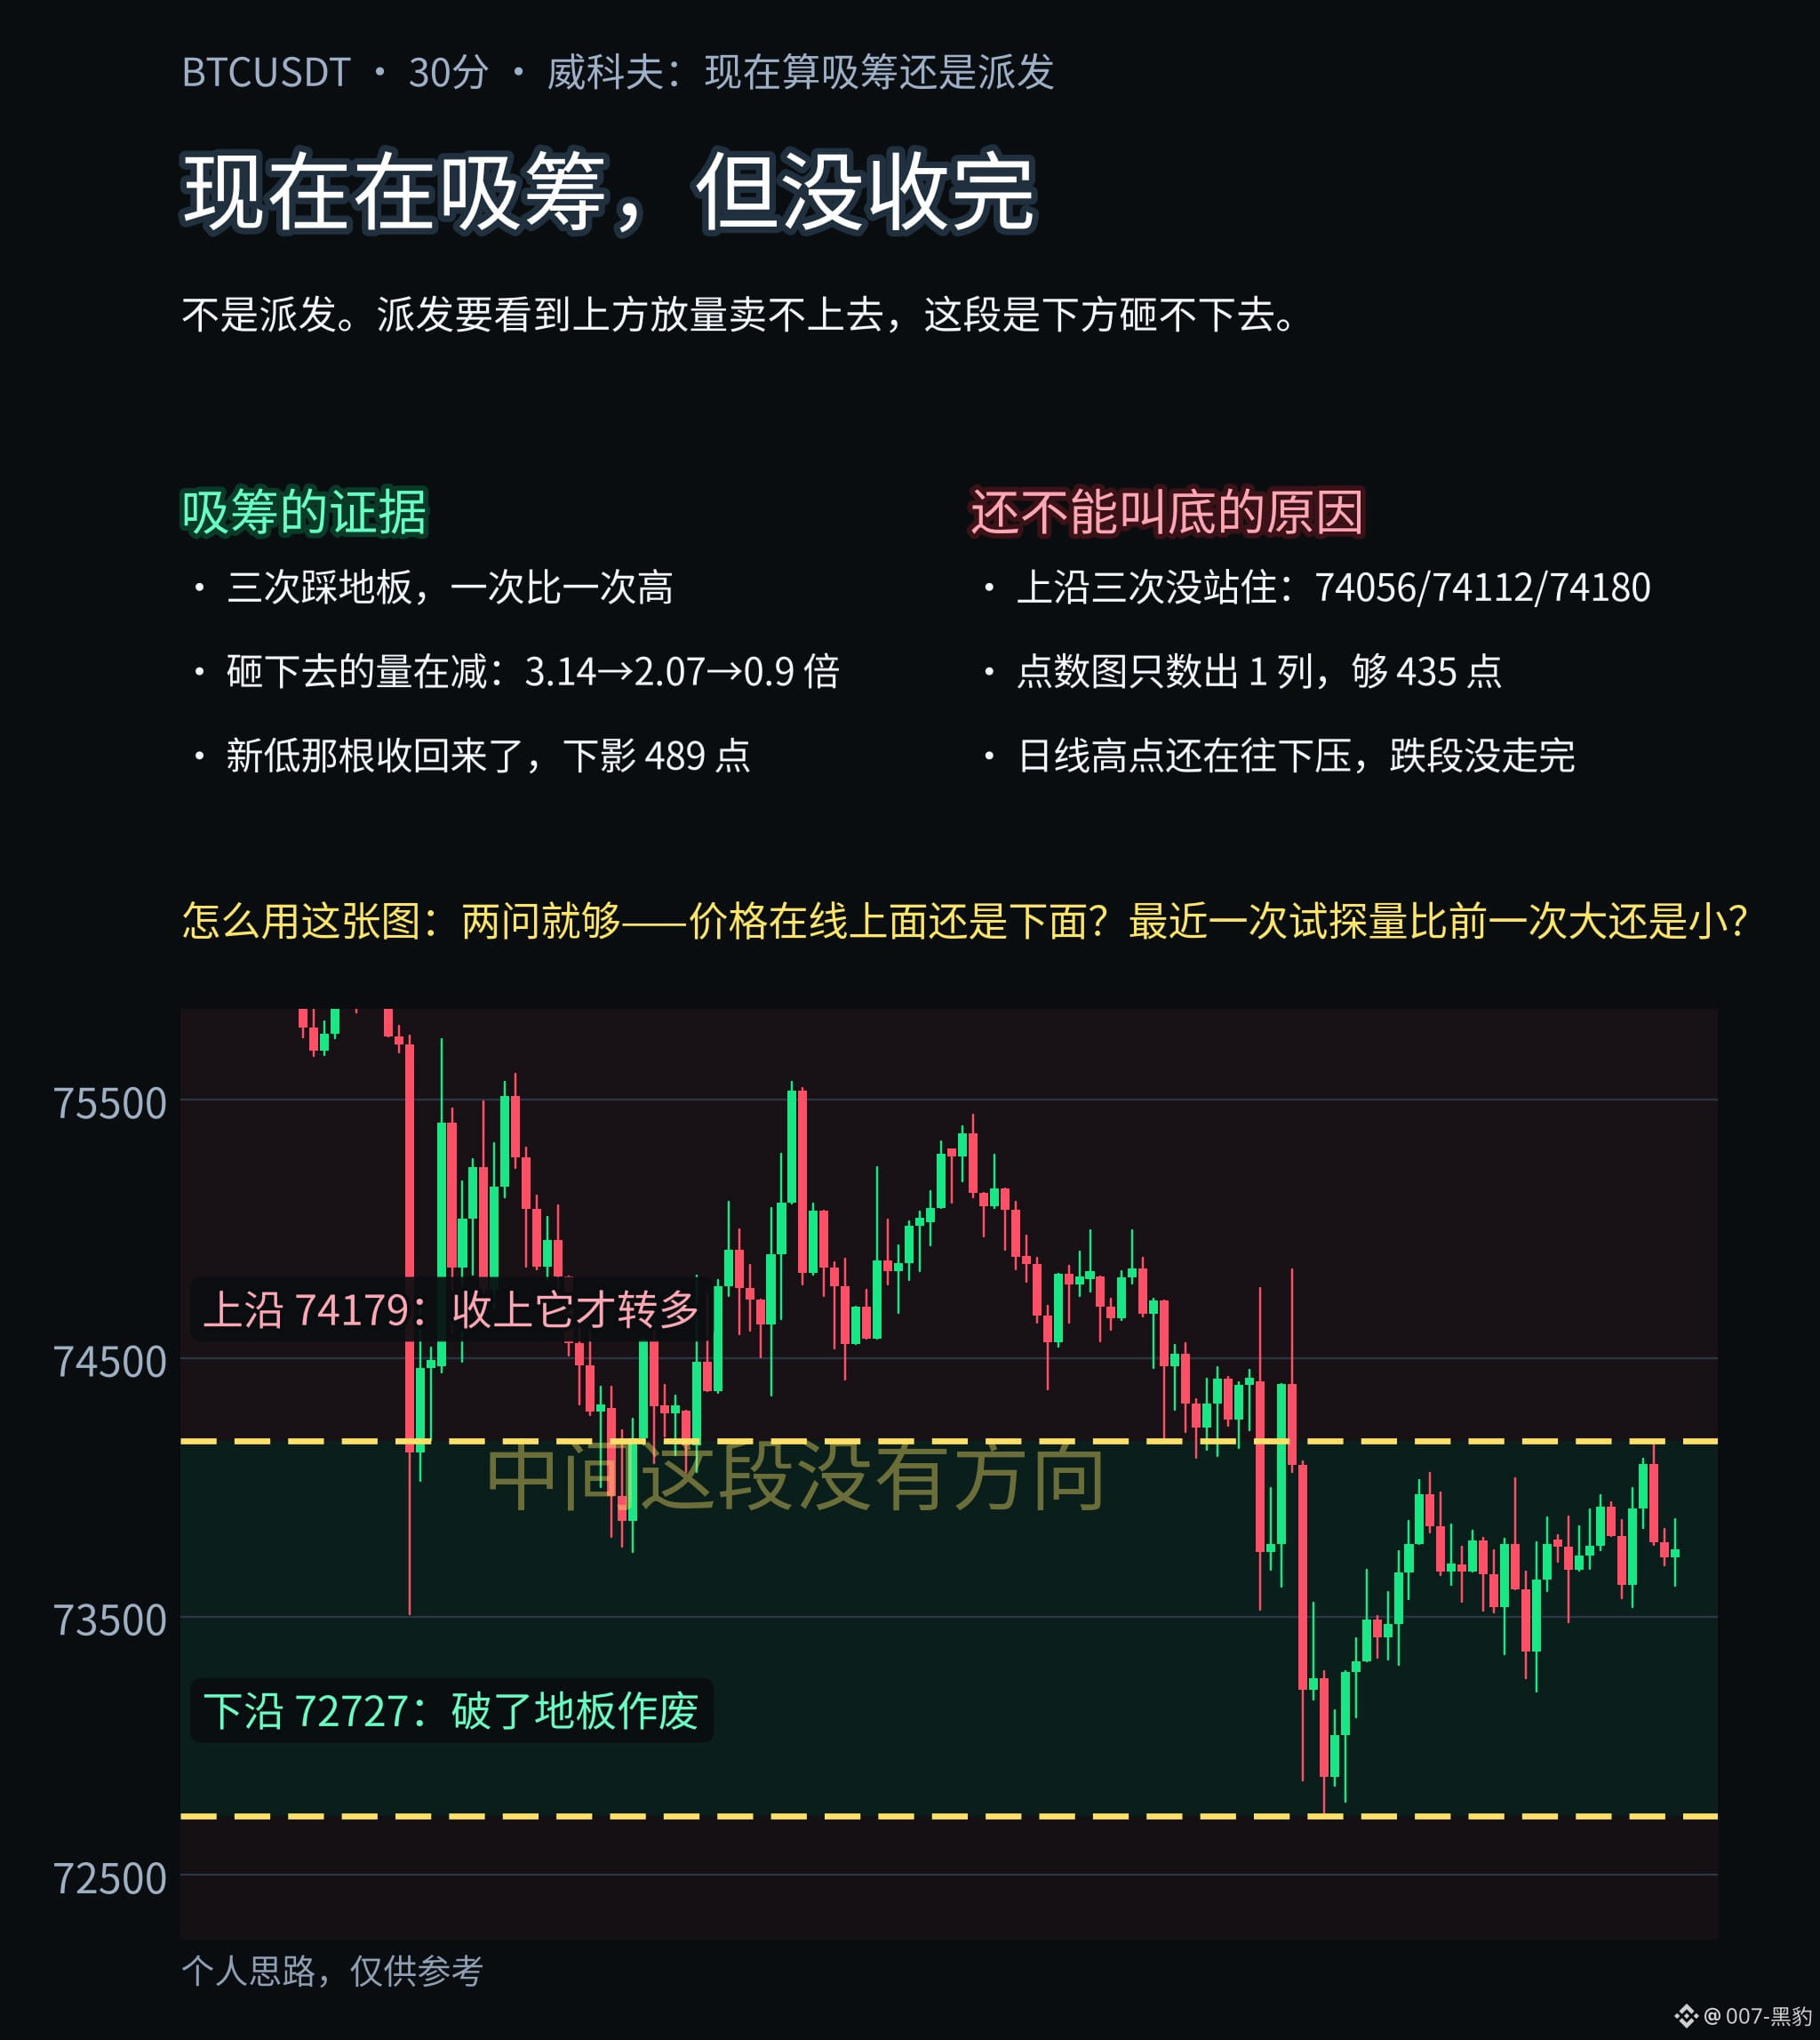
Bottom line first: This is accumulation, not distribution. It’s moving sideways right now—neither a reversal nor a rebound. It hasn’t chosen a direction yet.
To tell accumulation from distribution, look at where the selling pressure shows up. Distribution means heavy-volume selling near the highs that can’t push the price down: it bounces, volume picks up, but it can’t move higher; then it keeps drifting lower, with short lower wicks. This stretch is the opposite: it was slammed down three times to 72727, 73209, and 73478, each dip shallower than the last, while volume fell from 3.14x to 2.07x and then to 0.9x. The latest candle made a new low on the highest volume, but then recovered, leaving a 489-point lower wick. It’s also happening after a 3689-point drop, not near the highs. So this is accumulation, but it has only reached step four; a high-volume breakout has yet to appear.
To tell a reversal from a rebound, look at whether the structure has changed. A rebound turns back before breaking the previous high, edges upward on declining volume, lasts a few days, and then makes a new low. A reversal needs two things: first, it breaks the most recent significant high; then it pulls back without breaking the previous low, and the up candles have more volume than the down candles. Here, the previous high of 75442 hasn’t been touched, so the structure hasn’t changed. It’s neither.
Just remember these two boundaries; you don’t need anything else. A close above 74179 changes the situation from sideways trading to a test of the upside. That’s the rebound high after panic selling, not a level drawn on the chart. If it closes below 72727, then the idea that “someone is buying” is wrong, and the next level to watch below is 72292. There’s no direction in the 1,400 points between them.
How to handle a reversal: Don’t go heavy on the first breakout. In a small range that’s been sideways for three or four days, false breakouts are more common than real ones, so at most, test the waters with a small position the first time. Wait for a pullback to add to your core position: after moving above 74179, if it returns to around 74000 on declining volume without breaking the previous low, that’s the time to add. Put your stop just beyond the pullback low. Don’t pick arbitrary targets: the point-and-figure count gives only one column, enough for 435 points, so even the first leg of a genuine breakout would only reach around 74600.
How to handle a rebound: A rebound is an opportunity to sell, not to buy. Take only one trade: if it first reaches resistance and volume fails to keep up, that’s a short entry. If it rallies again a second time, don’t short it. Three don’ts: don’t chase the price higher, don’t take a large position, and don’t hold overnight betting on a breakout. If it closes above 74179 on strong volume, the situation has changed—acknowledge it immediately.
How to tell at a glance: After the price rises, does it pull back? If it pulls back and holds, it’s a reversal; if it surges straight up and then quickly breaks down, it’s a rebound. Treat any rise without a pullback as a rebound at first.
These are just my personal thoughts, for reference only. #比特币连续五周下跌 $BTC
Bottom line first: This is accumulation, not distribution. It’s moving sideways right now—neither a reversal nor a rebound. It hasn’t chosen a direction yet.
To tell accumulation from distribution, look at where the selling pressure shows up. Distribution means heavy-volume selling near the highs that can’t push the price down: it bounces, volume picks up, but it can’t move higher; then it keeps drifting lower, with short lower wicks. This stretch is the opposite: it was slammed down three times to 72727, 73209, and 73478, each dip shallower than the last, while volume fell from 3.14x to 2.07x and then to 0.9x. The latest candle made a new low on the highest volume, but then recovered, leaving a 489-point lower wick. It’s also happening after a 3689-point drop, not near the highs. So this is accumulation, but it has only reached step four; a high-volume breakout has yet to appear.
To tell a reversal from a rebound, look at whether the structure has changed. A rebound turns back before breaking the previous high, edges upward on declining volume, lasts a few days, and then makes a new low. A reversal needs two things: first, it breaks the most recent significant high; then it pulls back without breaking the previous low, and the up candles have more volume than the down candles. Here, the previous high of 75442 hasn’t been touched, so the structure hasn’t changed. It’s neither.
Just remember these two boundaries; you don’t need anything else. A close above 74179 changes the situation from sideways trading to a test of the upside. That’s the rebound high after panic selling, not a level drawn on the chart. If it closes below 72727, then the idea that “someone is buying” is wrong, and the next level to watch below is 72292. There’s no direction in the 1,400 points between them.
How to handle a reversal: Don’t go heavy on the first breakout. In a small range that’s been sideways for three or four days, false breakouts are more common than real ones, so at most, test the waters with a small position the first time. Wait for a pullback to add to your core position: after moving above 74179, if it returns to around 74000 on declining volume without breaking the previous low, that’s the time to add. Put your stop just beyond the pullback low. Don’t pick arbitrary targets: the point-and-figure count gives only one column, enough for 435 points, so even the first leg of a genuine breakout would only reach around 74600.
How to handle a rebound: A rebound is an opportunity to sell, not to buy. Take only one trade: if it first reaches resistance and volume fails to keep up, that’s a short entry. If it rallies again a second time, don’t short it. Three don’ts: don’t chase the price higher, don’t take a large position, and don’t hold overnight betting on a breakout. If it closes above 74179 on strong volume, the situation has changed—acknowledge it immediately.
How to tell at a glance: After the price rises, does it pull back? If it pulls back and holds, it’s a reversal; if it surges straight up and then quickly breaks down, it’s a rebound. Treat any rise without a pullback as a rebound at first.
These are just my personal thoughts, for reference only. #比特币连续五周下跌 $BTC