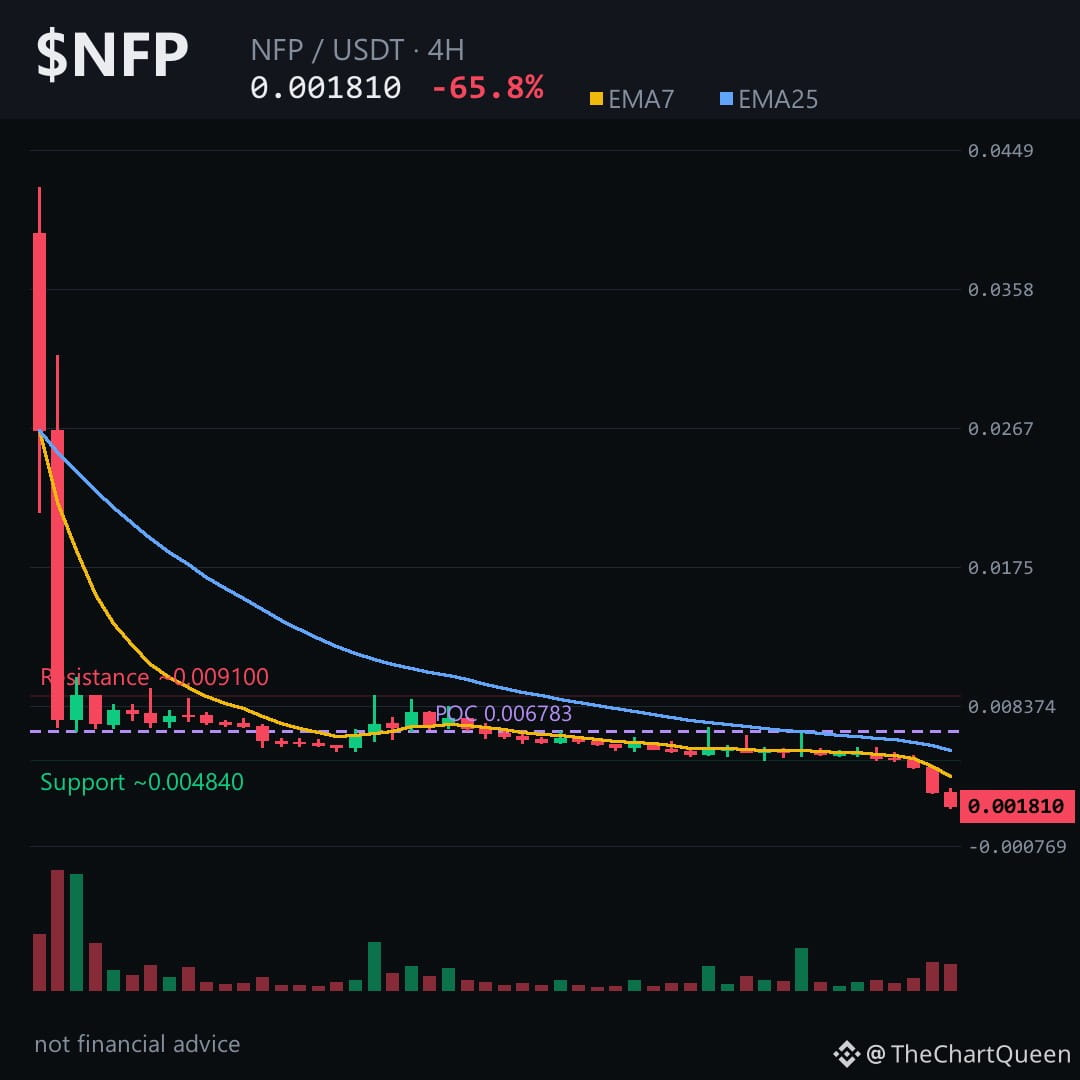
65.85% 24h plunge left $NFP barely above its 4‑hour pivot – a fragile spot you can’t ignore. 👀
Price is entrenched in bearish territory: EMA7 sits under EMA25, RSI is at a deep 12.9, and a clear bearish FVG sits between 0.00479 and 0.00445. The volume‑profile POC sits higher than the market, hinting that buying pressure has already been exhausted.
On the 4‑hour chart the key zones line up: the current pivot hovers around 0.00182; a break above ~0.00191 would nullify the bearish case, while a slide toward the ~0.00166 area could become the next demand pocket. If $NFP slips below the ~0.00166 zone, the downtrend gains a stronger foothold. Tap $NFP to pull up the chart and see these levels yourself.
My read: the market is testing the ~0.00166 demand zone; a decisive close below it would reinforce the bearish outlook, whereas a clean close above ~0.00191 would force a reassessment.
Follow me for the next update when NFP finally confirms which side of the zone it respects. Which level are you watching for NFP? 👇
⚠️ Not financial advice. DYOR.
#NFP #Crypto #BinanceSquare #TopLoser
Price is entrenched in bearish territory: EMA7 sits under EMA25, RSI is at a deep 12.9, and a clear bearish FVG sits between 0.00479 and 0.00445. The volume‑profile POC sits higher than the market, hinting that buying pressure has already been exhausted.
On the 4‑hour chart the key zones line up: the current pivot hovers around 0.00182; a break above ~0.00191 would nullify the bearish case, while a slide toward the ~0.00166 area could become the next demand pocket. If $NFP slips below the ~0.00166 zone, the downtrend gains a stronger foothold. Tap $NFP to pull up the chart and see these levels yourself.
My read: the market is testing the ~0.00166 demand zone; a decisive close below it would reinforce the bearish outlook, whereas a clean close above ~0.00191 would force a reassessment.
Follow me for the next update when NFP finally confirms which side of the zone it respects. Which level are you watching for NFP? 👇
⚠️ Not financial advice. DYOR.
#NFP #Crypto #BinanceSquare #TopLoser