📊 Cryptocurrency Analysis $SOL
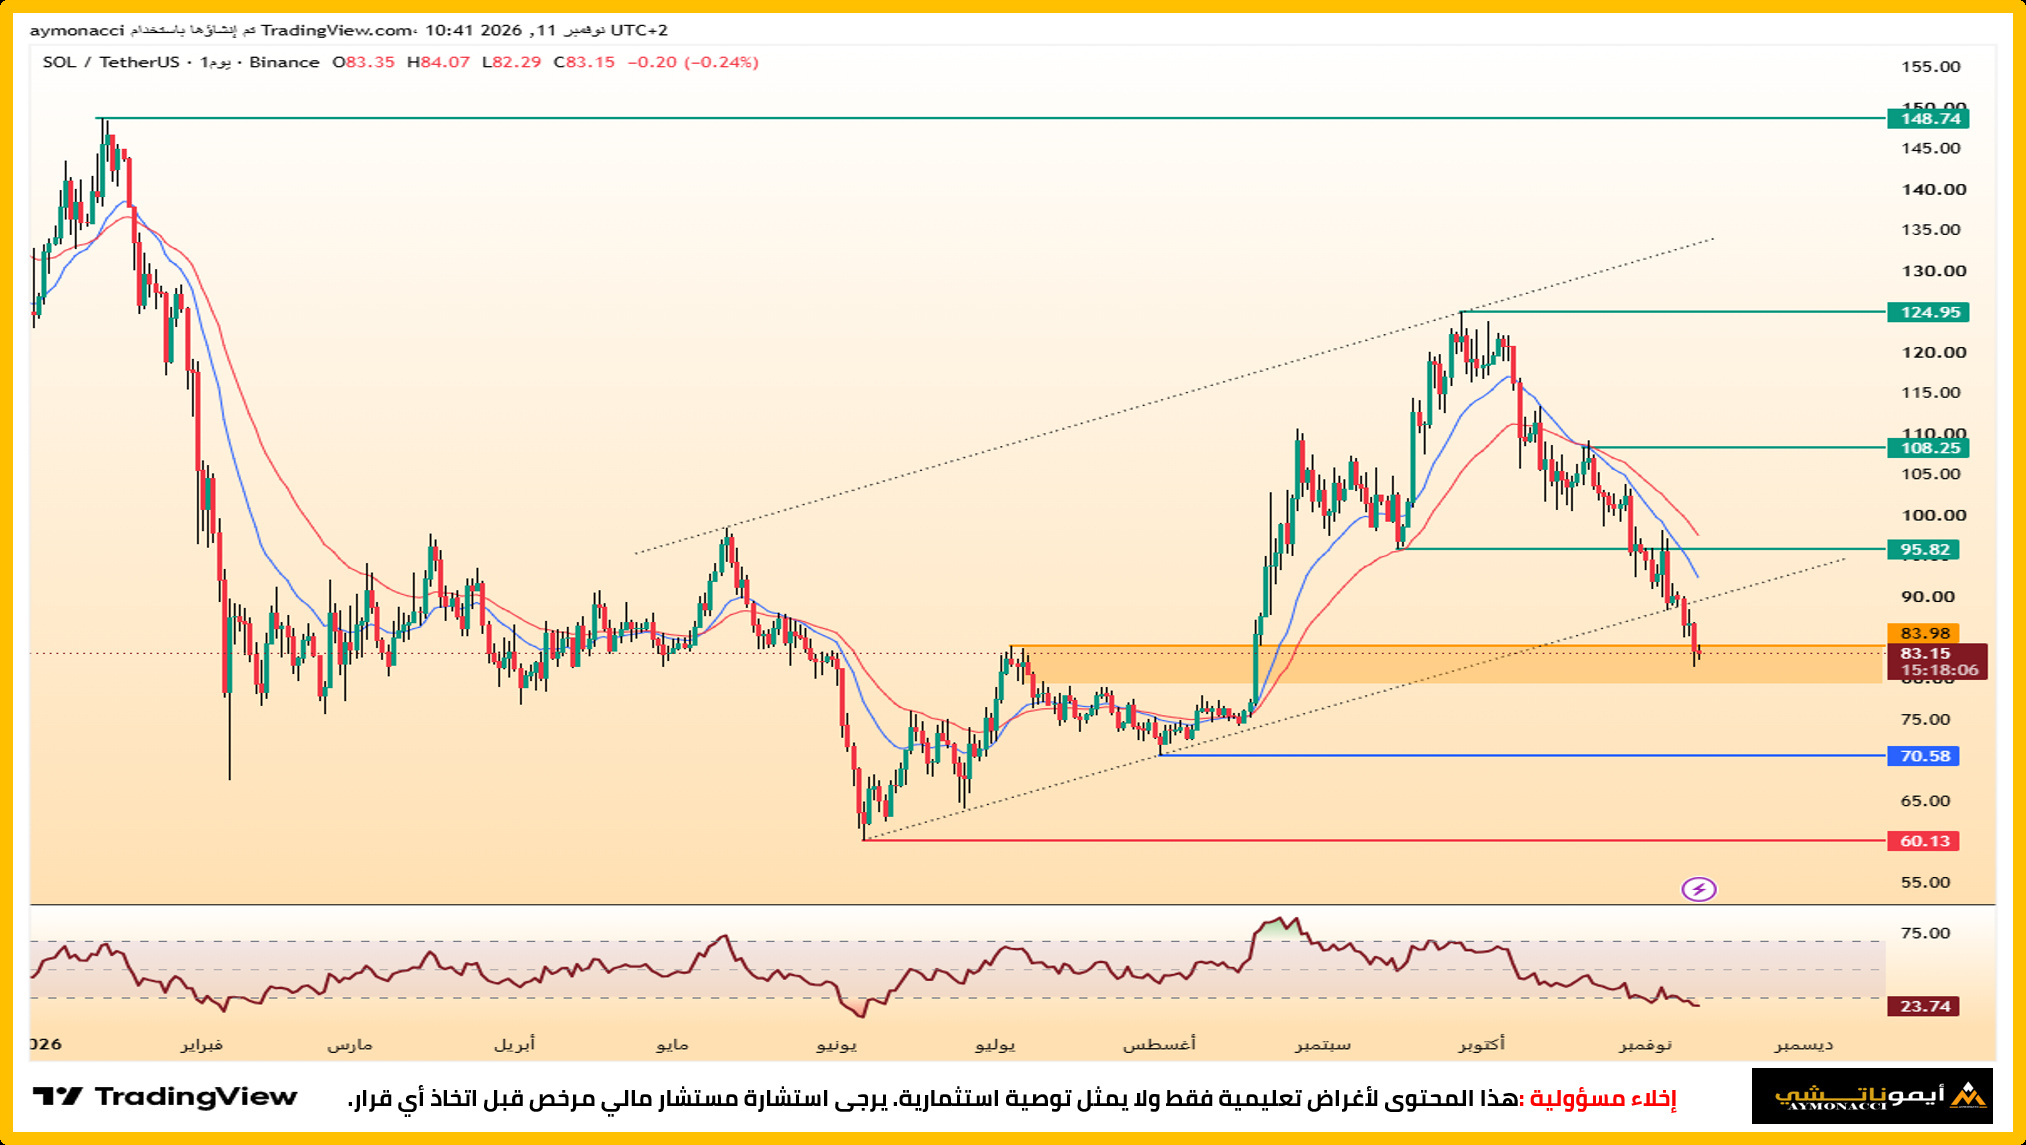
The daily chart for #SOLUSDT (Solana) shows trading under sustained selling pressure following a decline from the peak of $124.95. The price is currently trading at $83.15, down 0.24%. Here is a technical reading of the current situation:
Price action: The price is trading at $83.15, testing the nearby support and consolidation zone just below the pivot point. The Relative Strength Index (RSI) has reached a low of 23.74, reflecting severely oversold conditions and the growing potential for a corrective rebound.
Pivot point (PP): At $83.98, this level is very close to the current price. A breakout above it and holding there would be key to a rebound and a recovery of balance.
Resistance levels: If an upward rebound occurs and the pivot point is surpassed, the target levels are $95.82, followed by resistance at $108.25, then $124.95, and finally the chart’s highest peak at $148.74.
Support levels: If selling pressure continues, important support levels are at $70.58, followed by the key near-term support marked in red at $60.13, which could absorb the downward wave.
#SOL #SOLUSDT #Crypto #Aymonacci #Binance
“This analysis is for educational purposes only and does not constitute financial advice.”
The daily chart for #SOLUSDT (Solana) shows trading under sustained selling pressure following a decline from the peak of $124.95. The price is currently trading at $83.15, down 0.24%. Here is a technical reading of the current situation:
Price action: The price is trading at $83.15, testing the nearby support and consolidation zone just below the pivot point. The Relative Strength Index (RSI) has reached a low of 23.74, reflecting severely oversold conditions and the growing potential for a corrective rebound.
Pivot point (PP): At $83.98, this level is very close to the current price. A breakout above it and holding there would be key to a rebound and a recovery of balance.
Resistance levels: If an upward rebound occurs and the pivot point is surpassed, the target levels are $95.82, followed by resistance at $108.25, then $124.95, and finally the chart’s highest peak at $148.74.
Support levels: If selling pressure continues, important support levels are at $70.58, followed by the key near-term support marked in red at $60.13, which could absorb the downward wave.
#SOL #SOLUSDT #Crypto #Aymonacci #Binance
“This analysis is for educational purposes only and does not constitute financial advice.”