I’m used to marking the time a news item is published on the intraday chart, then comparing it with subsequent price movements.
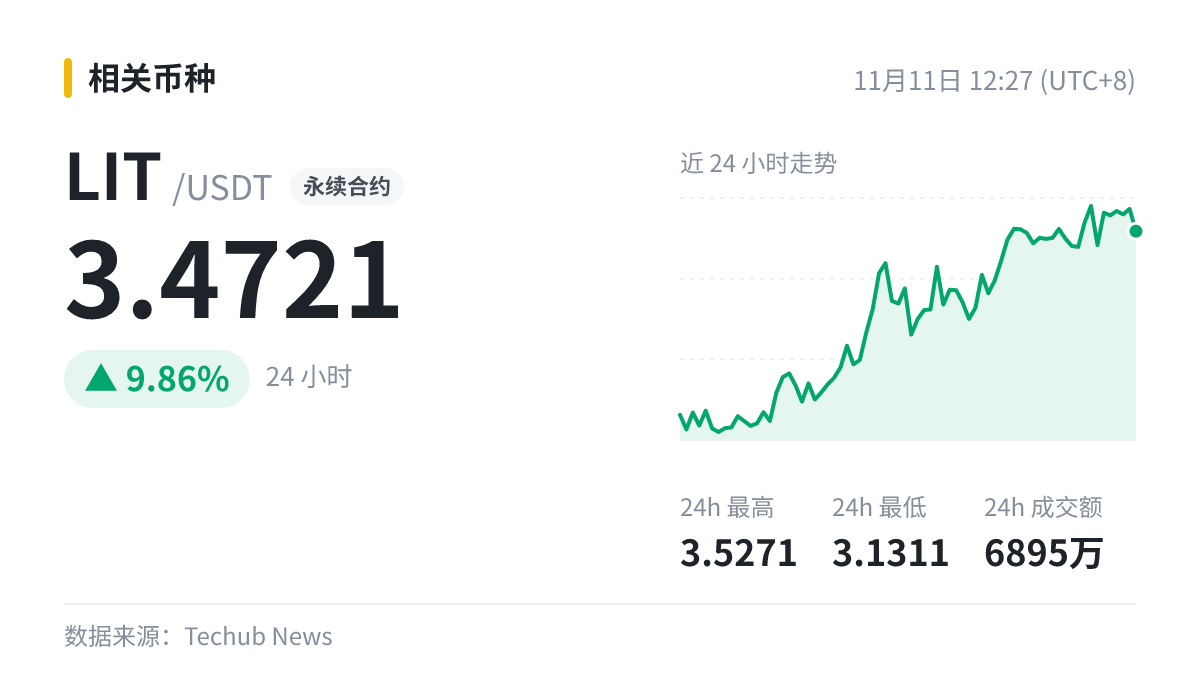
For example, this one here: Swiss bank Sygnum lists LIT, and LIT rises 10.8%, $LIT (24h +9.86%).
Another piece of positive news—but whether the trend has changed still has to be determined by the candlestick chart.
For example, this one here: Swiss bank Sygnum lists LIT, and LIT rises 10.8%, $LIT (24h +9.86%).
Another piece of positive news—but whether the trend has changed still has to be determined by the candlestick chart.