
🌿11.11 Midday Market Outlook.🌿
$BTC 's view:
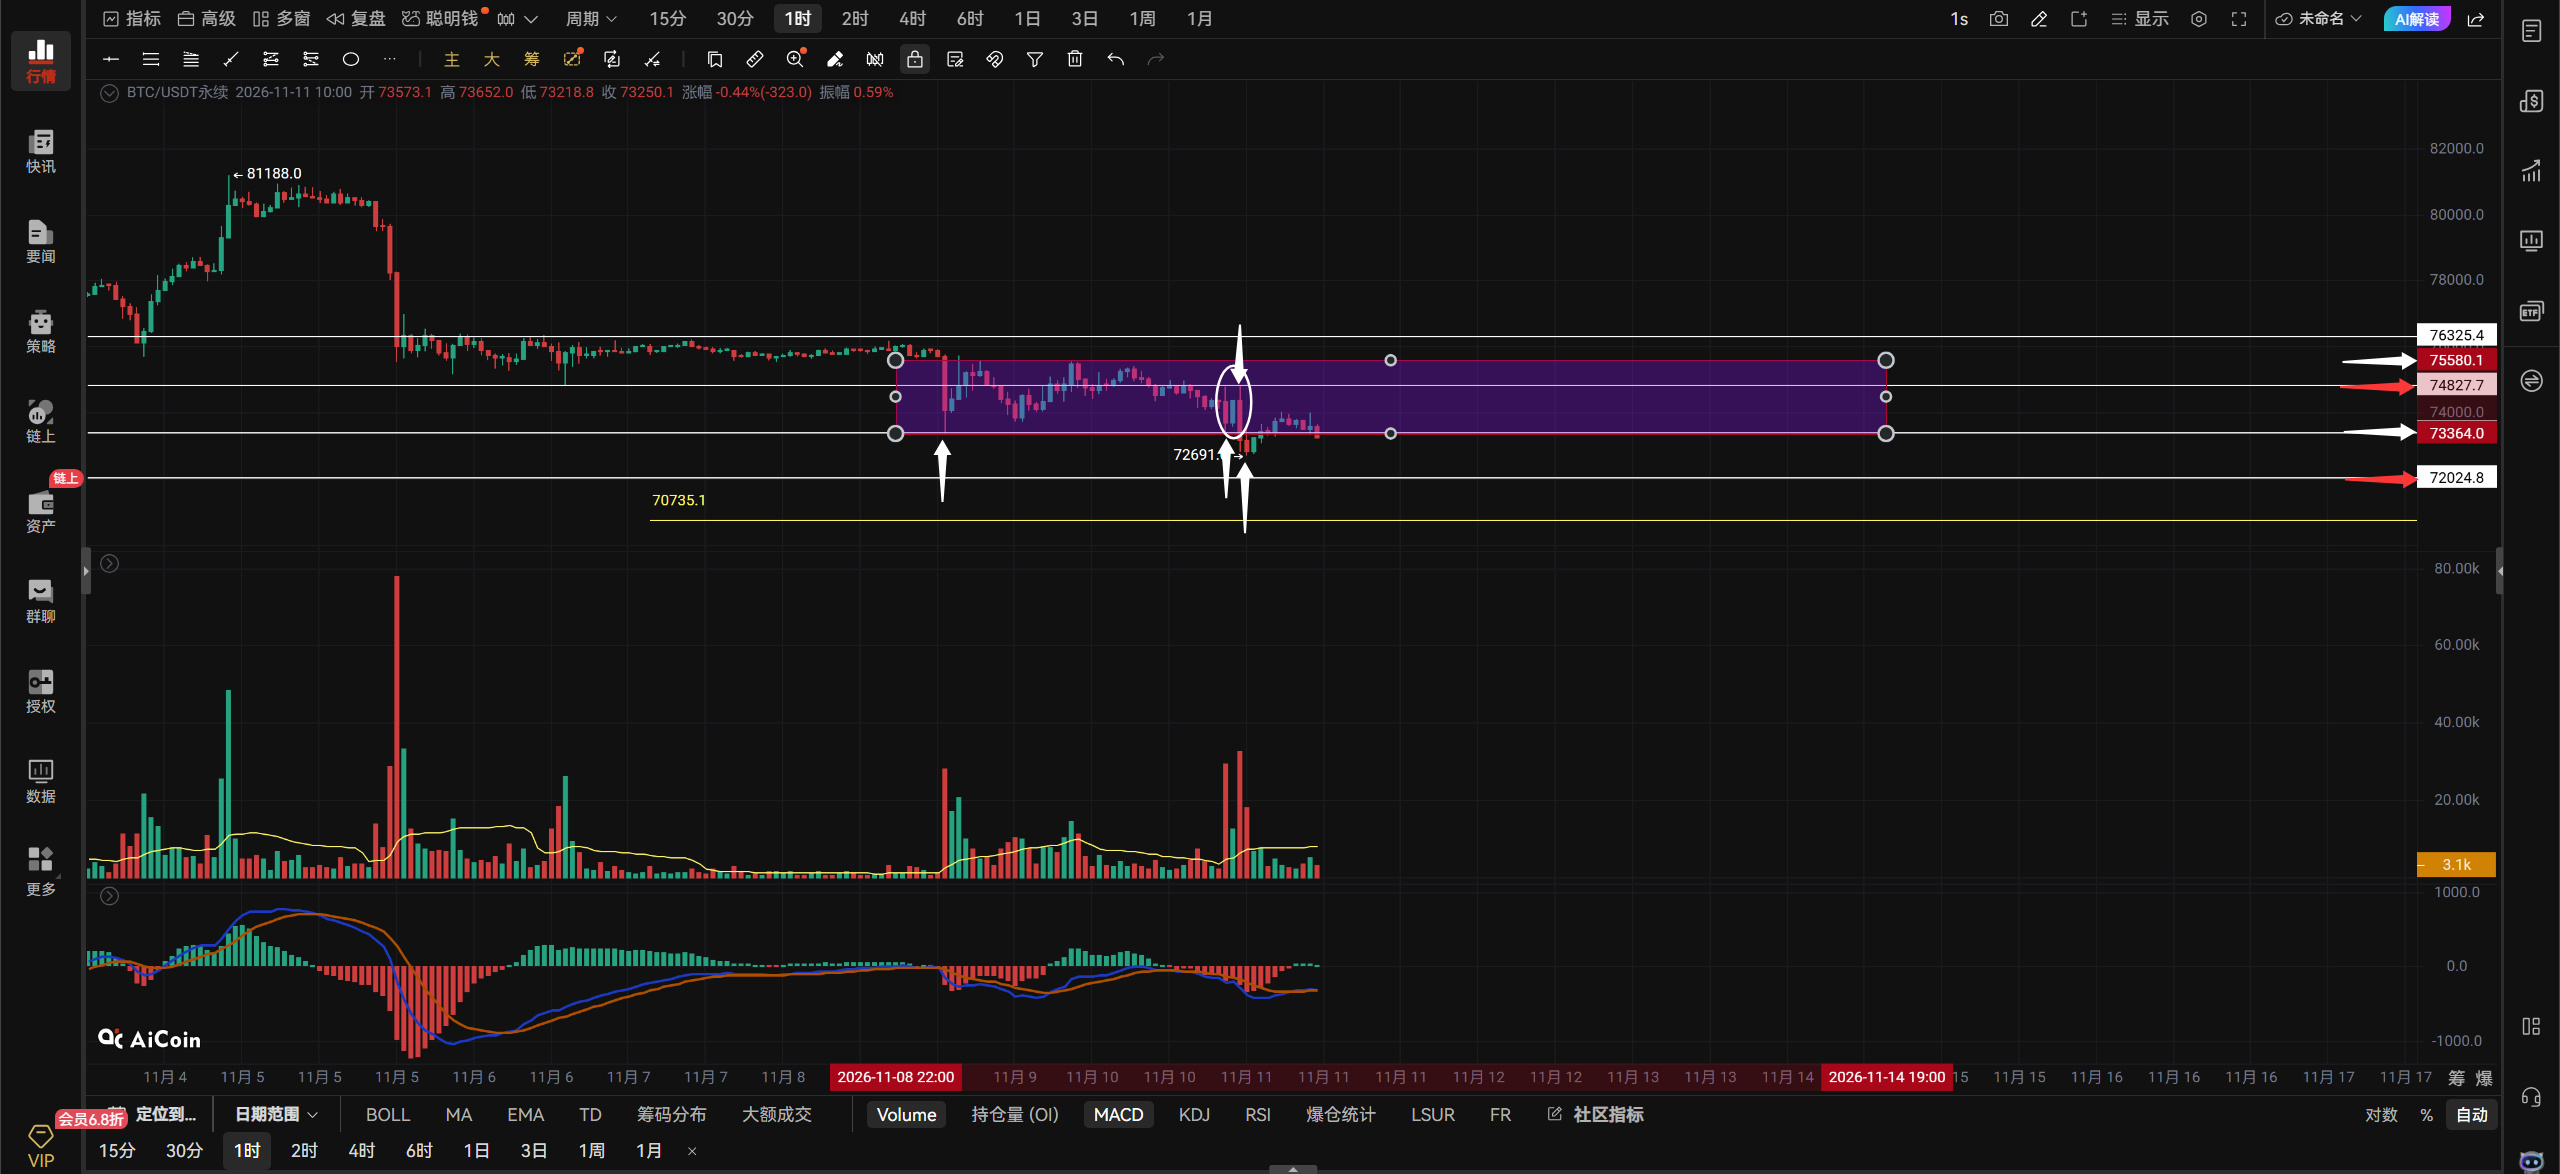
Bitcoin has really been discounted again this 11.11. I can tell you very clearly now: there is no bullish trend on any timeframe. Until price reclaims and stays above 75000, every bounce is an opportunity to short. Bitcoin's 75580–73364 consolidation range has been broken. Next, watch whether Bitcoin can hold above 73364. If it can, there's still a chance of an upward bounce; if it can't hold 73364, then wait for Bitcoin to test 72024! I originally thought the previous low wouldn't be broken—the white arrow below points to it—because there wasn't much bad news out there, and a bottom signal appeared in the area marked by the white box. But the bounce failed to break through the resistance at 74827, and then a single large bearish candle smashed through the previous low and made an even lower low. Although Bitcoin has made a lower low, the ratio of long to short positions hasn't fallen; it remains high at 2.9. Looks like everyone's enthusiasm for buying the dip hasn't waned! Everyone wants to buy the dip, and so do I, but looking at the current market, there isn't even a bottom in sight! Price was rising just fine, then suddenly got dumped. For Bitcoin to rise, it must break through the 74827–75580 resistance zone to start a rebound; there's no point if it can't break through this zone. Those looking to go long should watch for Bitcoin to retest the previous low and see if a bottom signal appears before entering; otherwise, wait to short in the 74827–75580 zone!
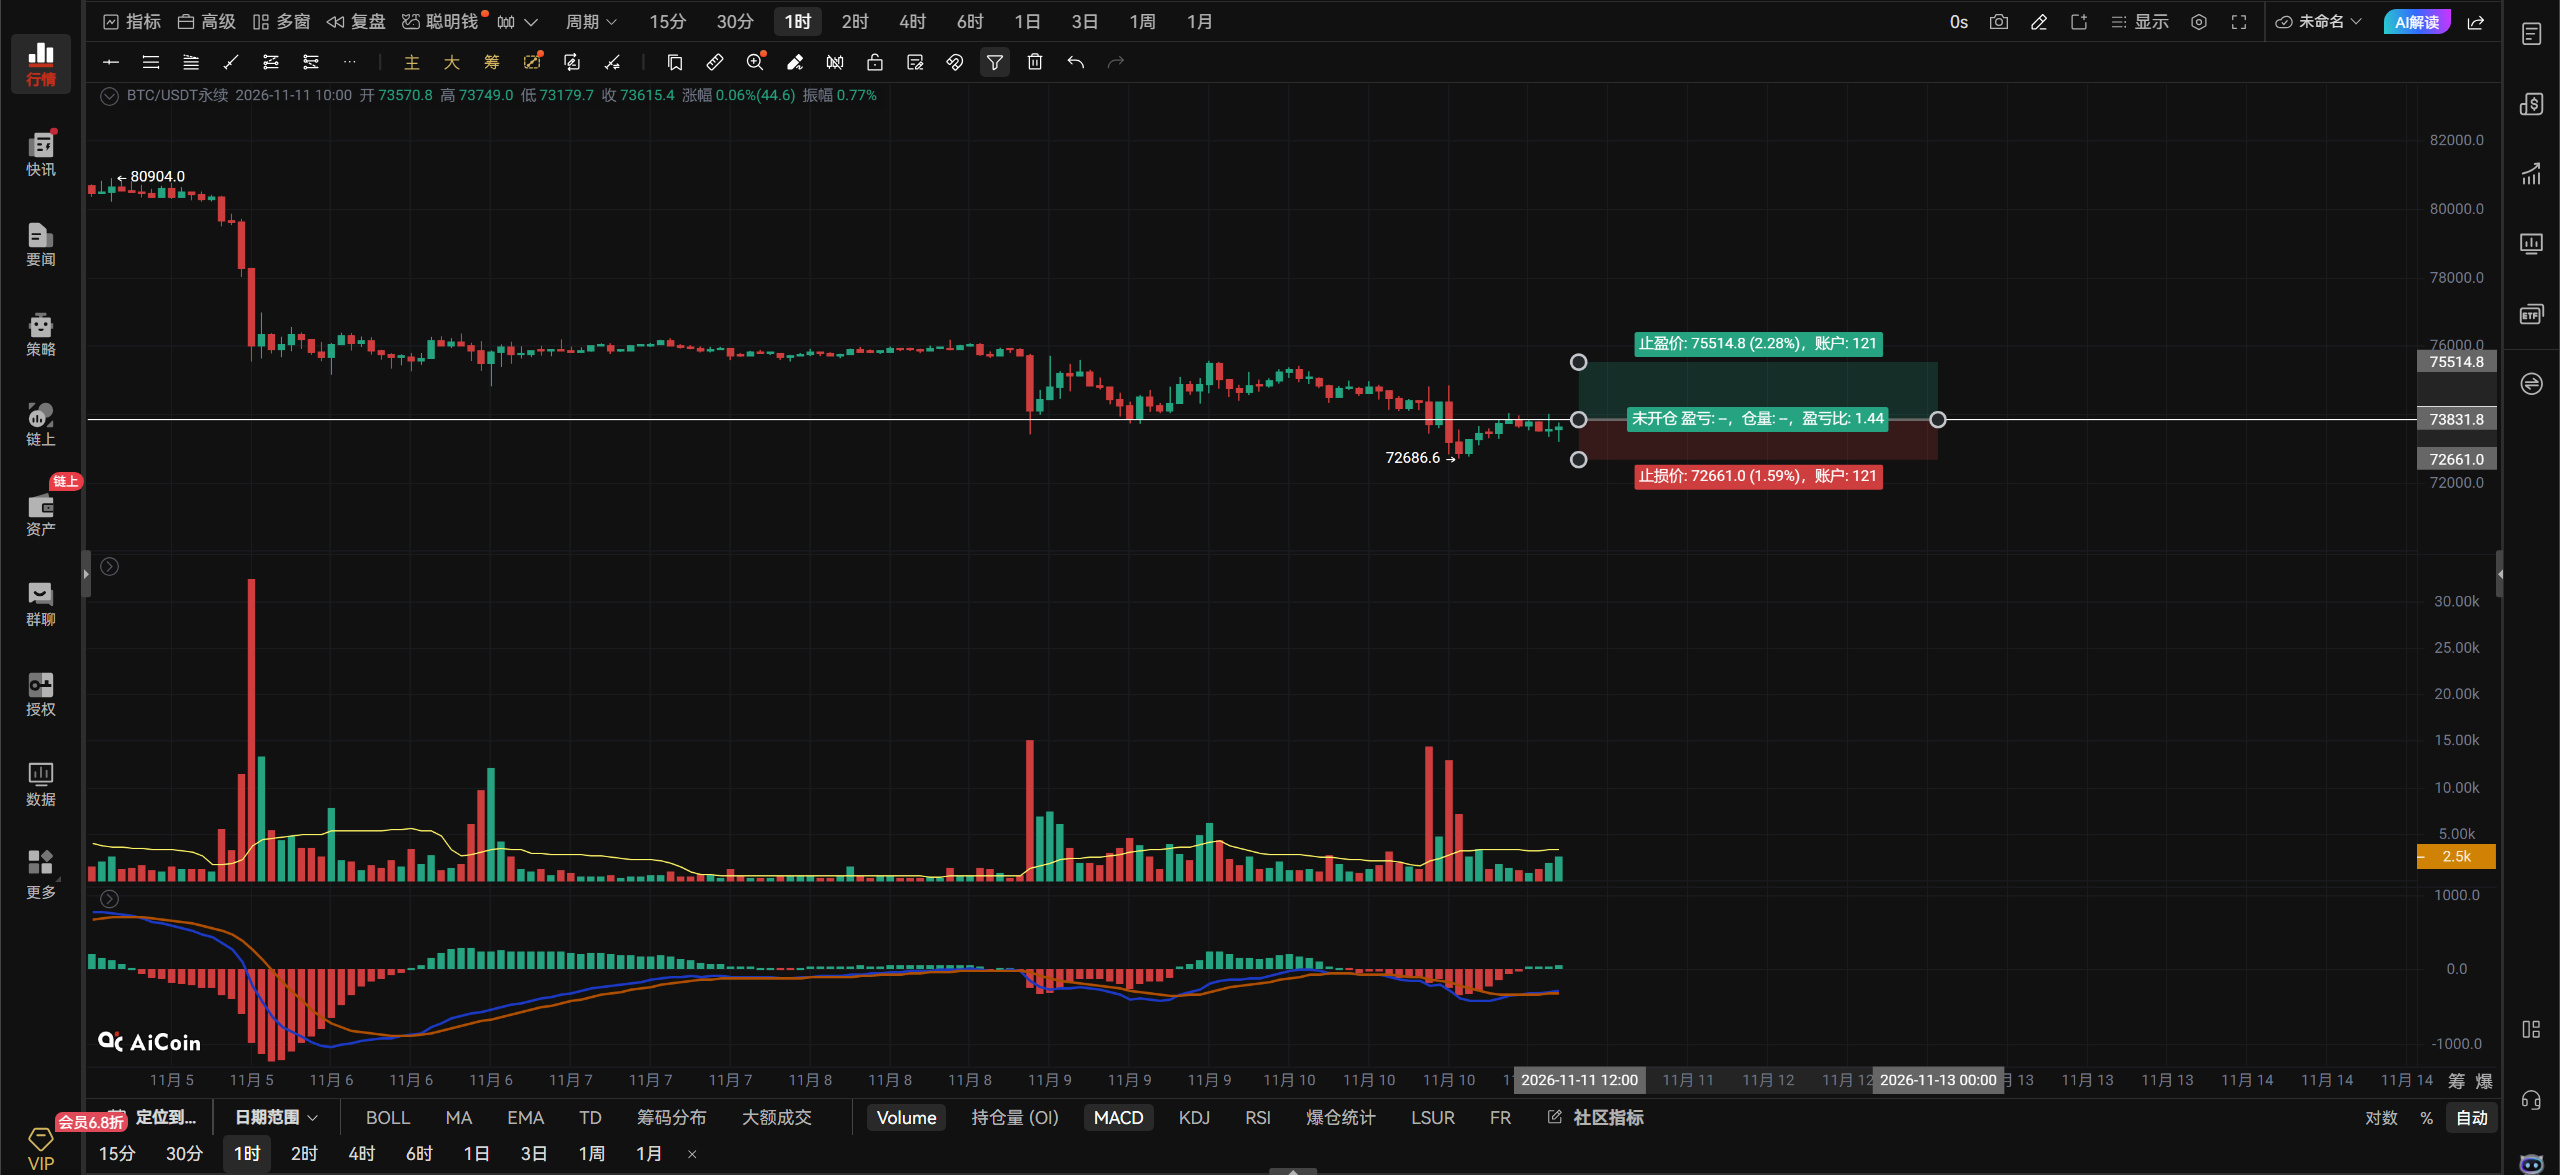
If Bitcoin breaks above 73875 with volume, aggressive traders can chase a long on the right side. If it rebounds to 75539, take a light short on the left side, with a stop-loss in place.
On the hourly chart, if Bitcoin breaks above and holds 73875, look for 74827–75539; if it can't get above 73875, there's no point.
On the 4-hour chart, if price breaks below 73384, look for 72691–72024.
Resistance above: 73875–74827–75539
Support below: 73384–72691–72024
$ETH 's view:
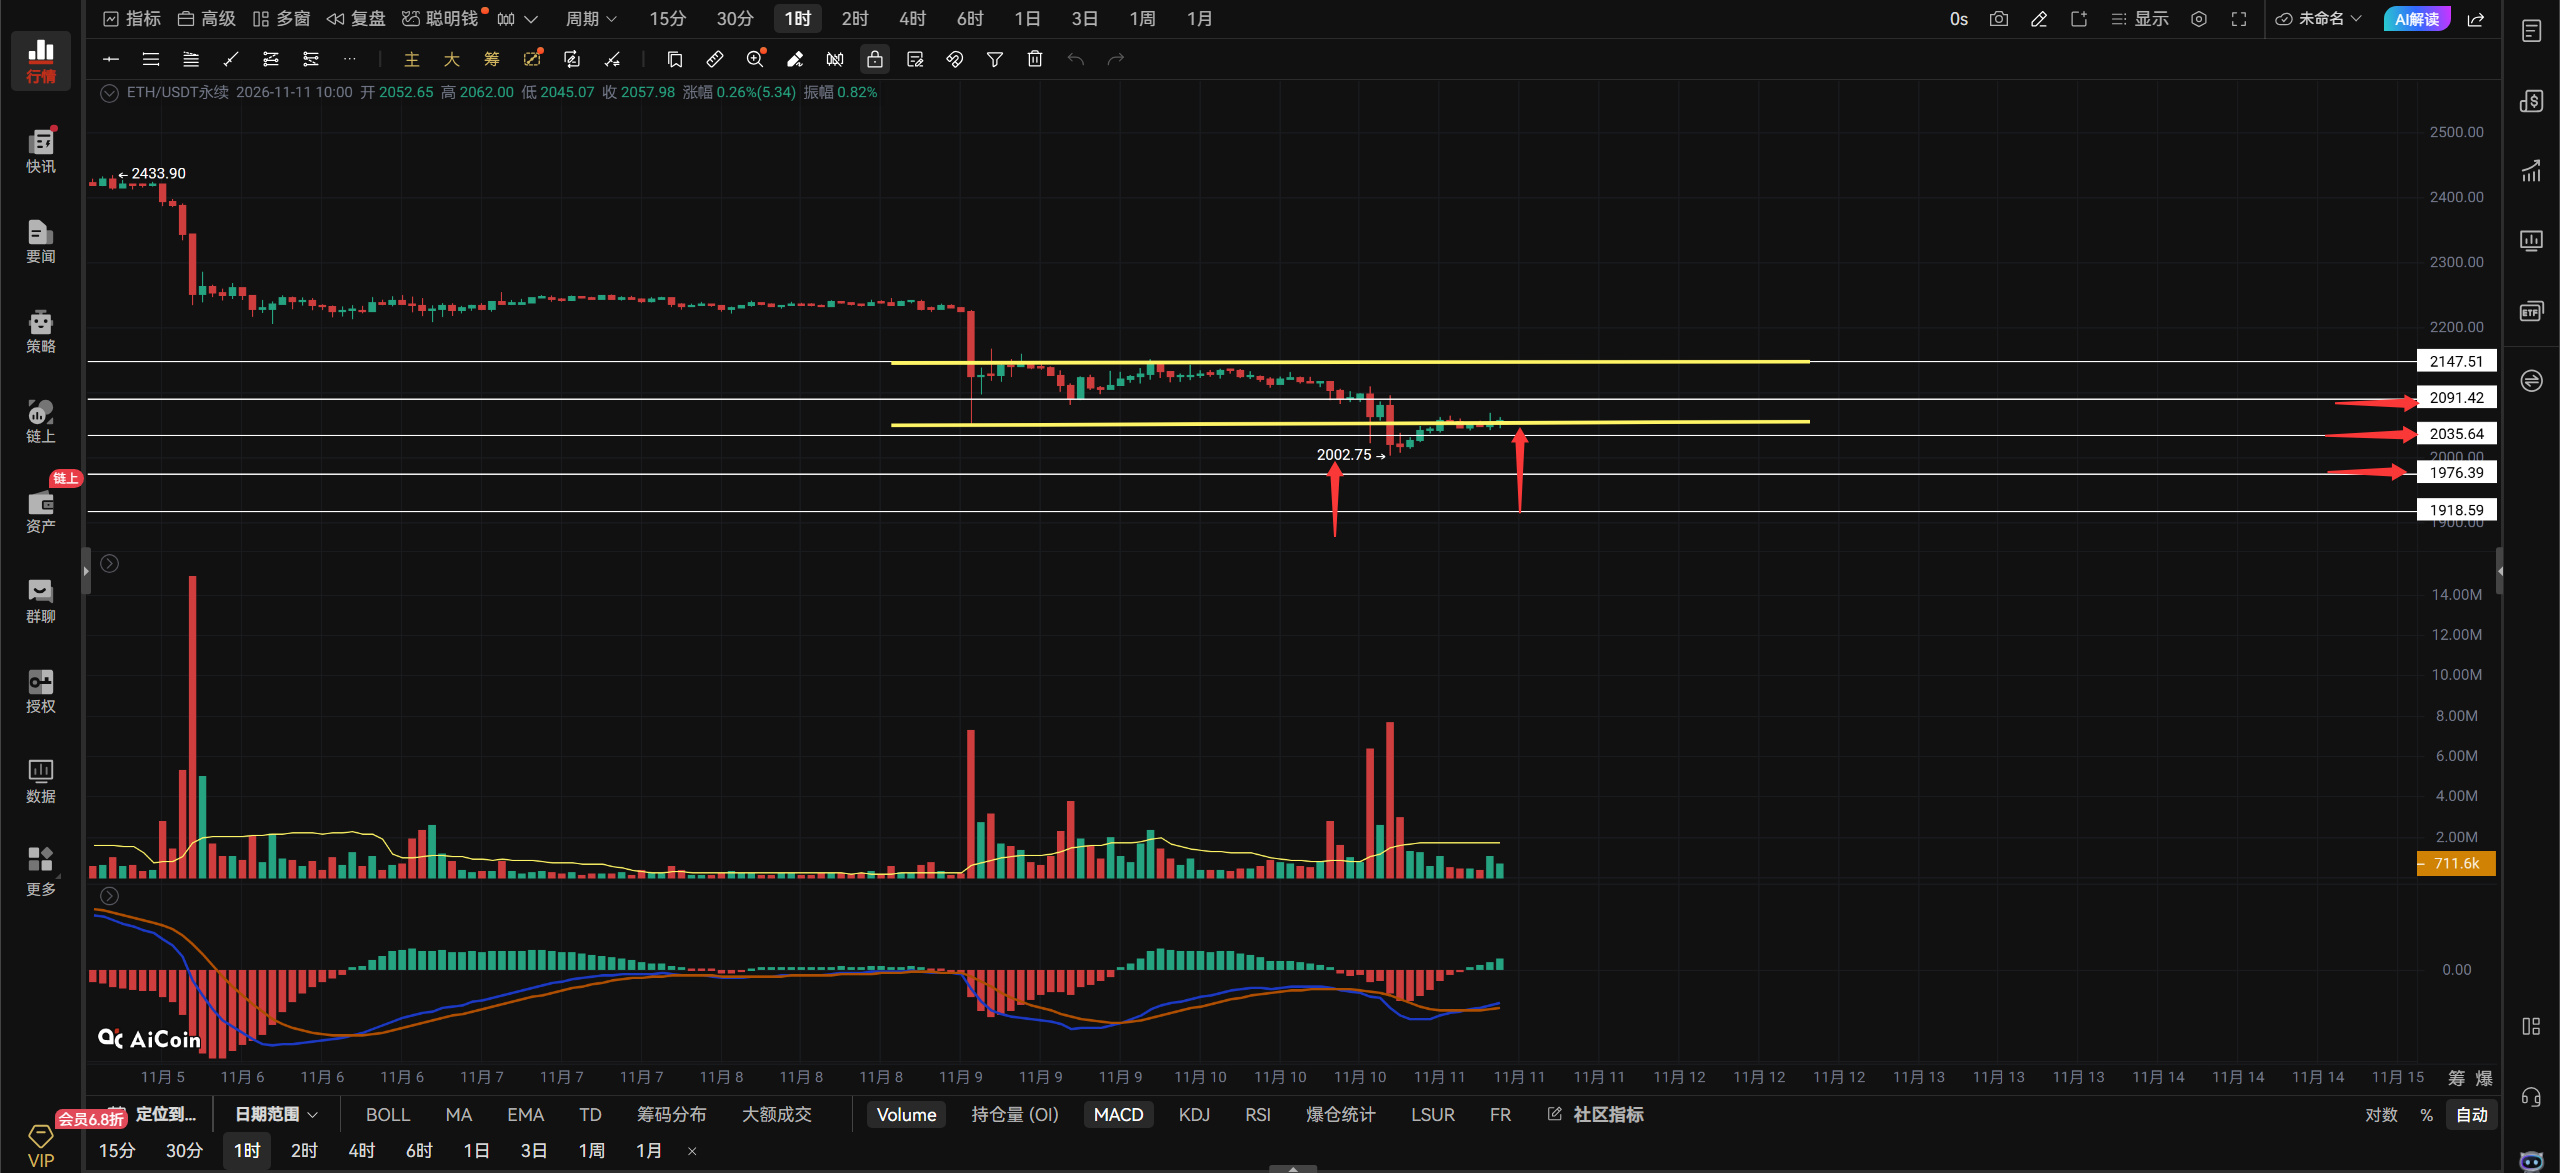
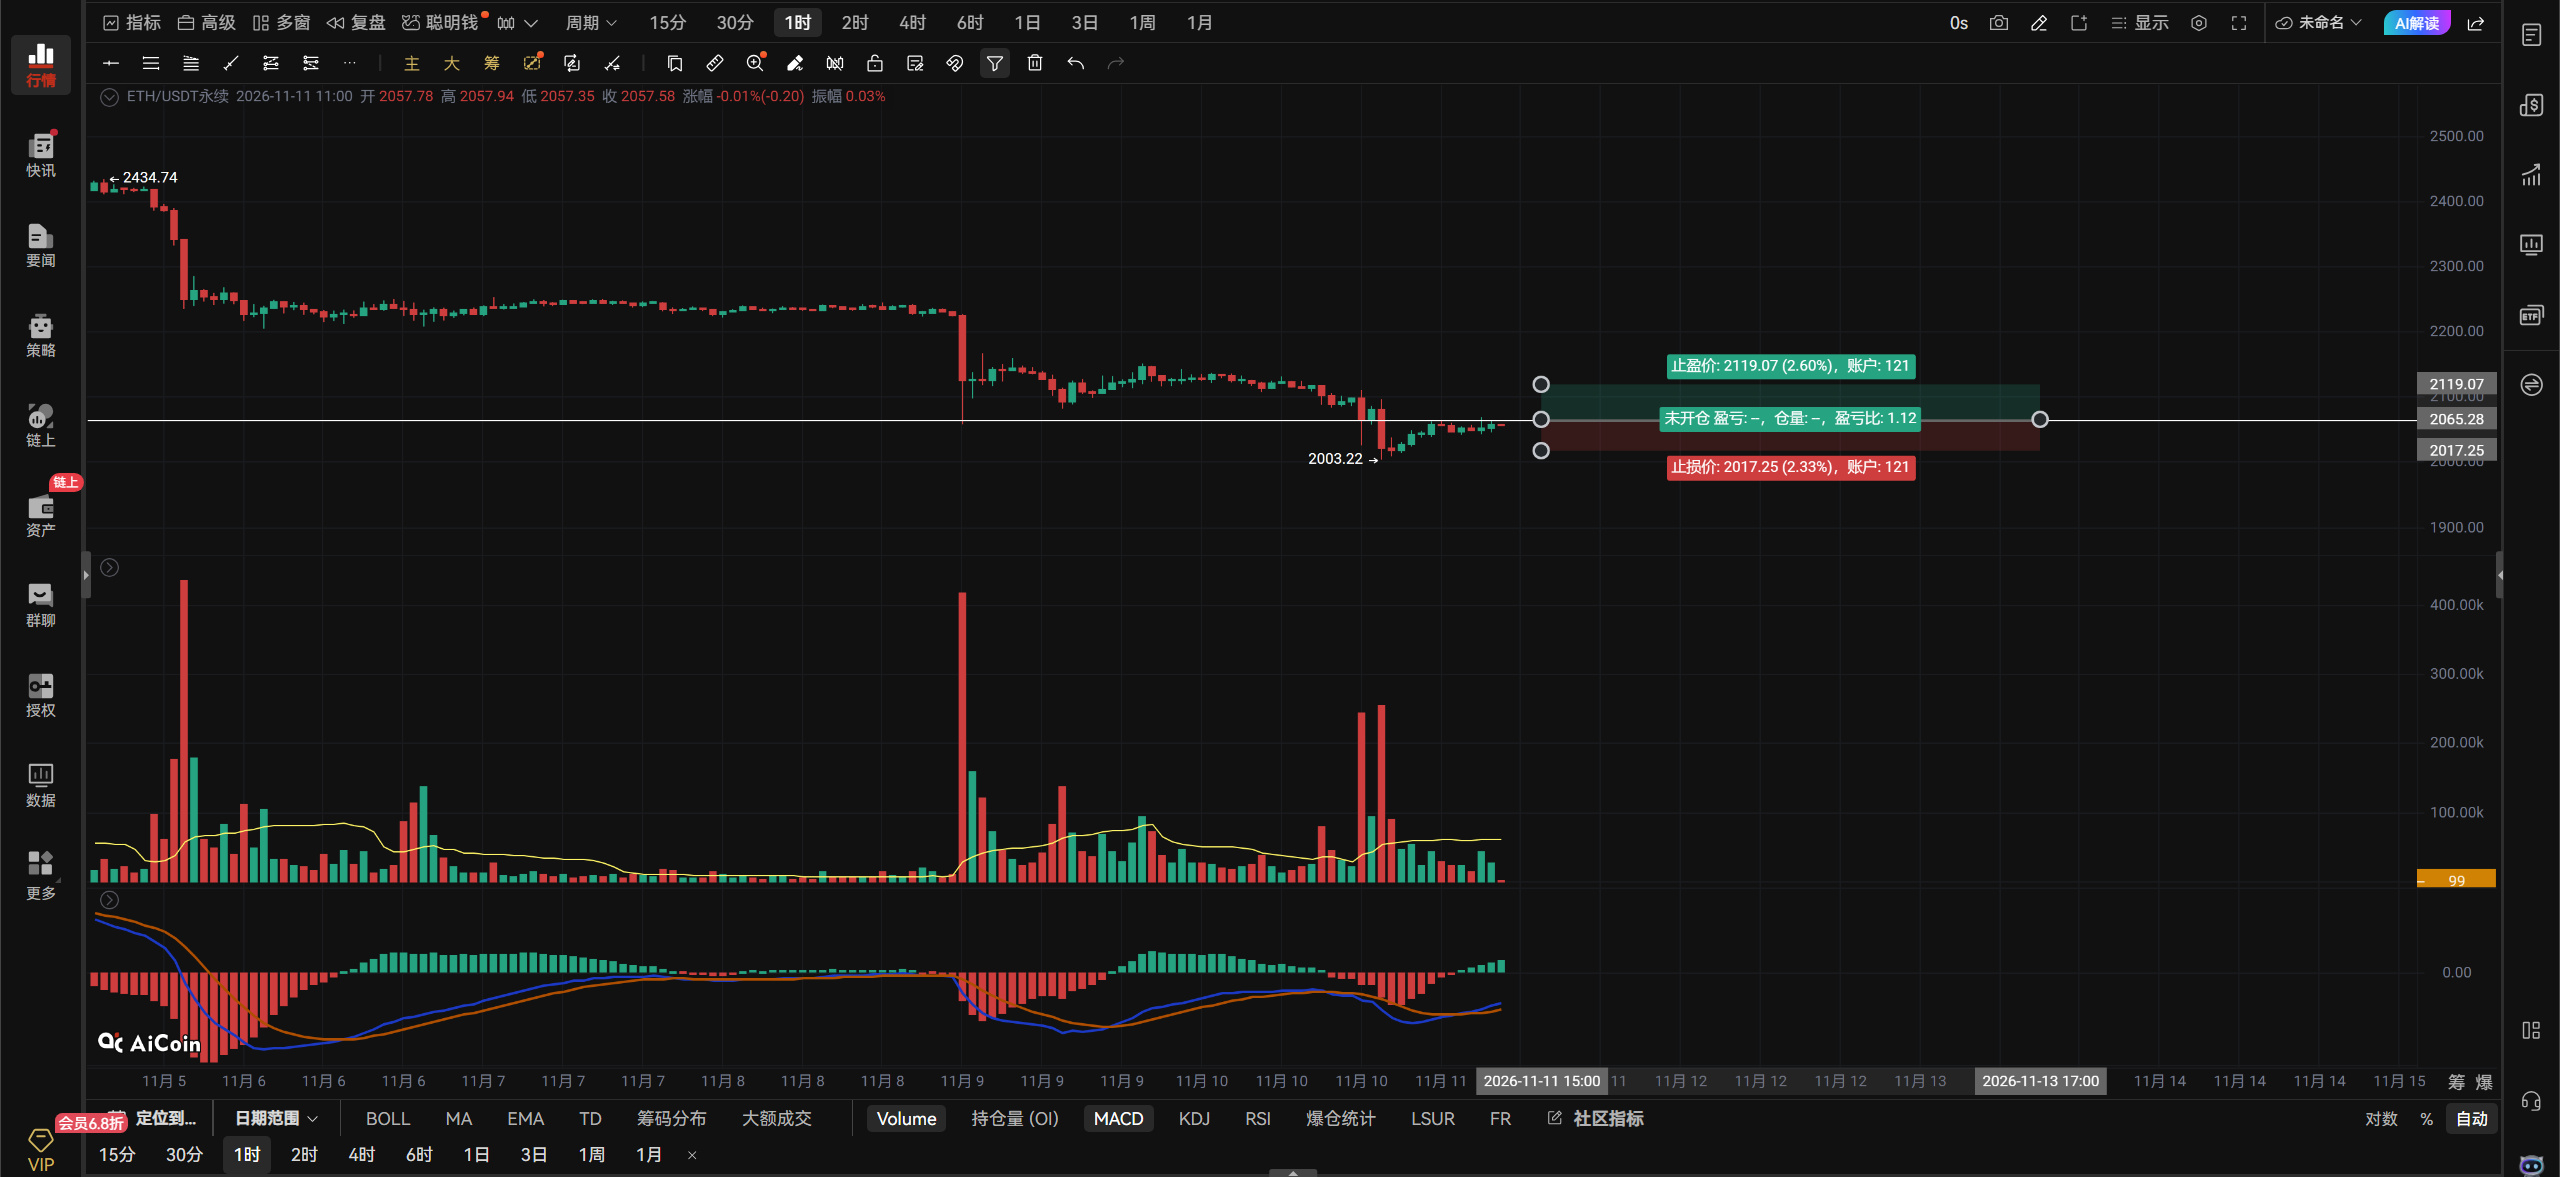
If ETH breaks above 2063 with volume, chase a long on the right side, with a stop-loss in place.
If it breaks below 2052 with volume, chase a short on the right side, with a stop-loss in place.
If a retest of 2003 confirms that support is holding, add one unit to the long.
Stop out if price breaks below 1976.
On the hourly chart, if ETH holds above 2063, look for 2092–2147.
Watch for ETH to reach 2092 to take a short; stop out if it breaks above 2147.
Left-side wick orders: long at 1976; stop out if price breaks below 1938.
Please see the comments section.
$BTC
#CPI高于预期,美股与BTC再度承压
$BTC 's view:
Bitcoin has really been discounted again this 11.11. I can tell you very clearly now: there is no bullish trend on any timeframe. Until price reclaims and stays above 75000, every bounce is an opportunity to short. Bitcoin's 75580–73364 consolidation range has been broken. Next, watch whether Bitcoin can hold above 73364. If it can, there's still a chance of an upward bounce; if it can't hold 73364, then wait for Bitcoin to test 72024! I originally thought the previous low wouldn't be broken—the white arrow below points to it—because there wasn't much bad news out there, and a bottom signal appeared in the area marked by the white box. But the bounce failed to break through the resistance at 74827, and then a single large bearish candle smashed through the previous low and made an even lower low. Although Bitcoin has made a lower low, the ratio of long to short positions hasn't fallen; it remains high at 2.9. Looks like everyone's enthusiasm for buying the dip hasn't waned! Everyone wants to buy the dip, and so do I, but looking at the current market, there isn't even a bottom in sight! Price was rising just fine, then suddenly got dumped. For Bitcoin to rise, it must break through the 74827–75580 resistance zone to start a rebound; there's no point if it can't break through this zone. Those looking to go long should watch for Bitcoin to retest the previous low and see if a bottom signal appears before entering; otherwise, wait to short in the 74827–75580 zone!
If Bitcoin breaks above 73875 with volume, aggressive traders can chase a long on the right side. If it rebounds to 75539, take a light short on the left side, with a stop-loss in place.
On the hourly chart, if Bitcoin breaks above and holds 73875, look for 74827–75539; if it can't get above 73875, there's no point.
On the 4-hour chart, if price breaks below 73384, look for 72691–72024.
Resistance above: 73875–74827–75539
Support below: 73384–72691–72024
$ETH 's view:
If ETH breaks above 2063 with volume, chase a long on the right side, with a stop-loss in place.
If it breaks below 2052 with volume, chase a short on the right side, with a stop-loss in place.
If a retest of 2003 confirms that support is holding, add one unit to the long.
Stop out if price breaks below 1976.
On the hourly chart, if ETH holds above 2063, look for 2092–2147.
Watch for ETH to reach 2092 to take a short; stop out if it breaks above 2147.
Left-side wick orders: long at 1976; stop out if price breaks below 1938.
Please see the comments section.
$BTC
#CPI高于预期,美股与BTC再度承压