Does the recent market action feel strangely familiar?
Have you seen this candlestick pattern before?
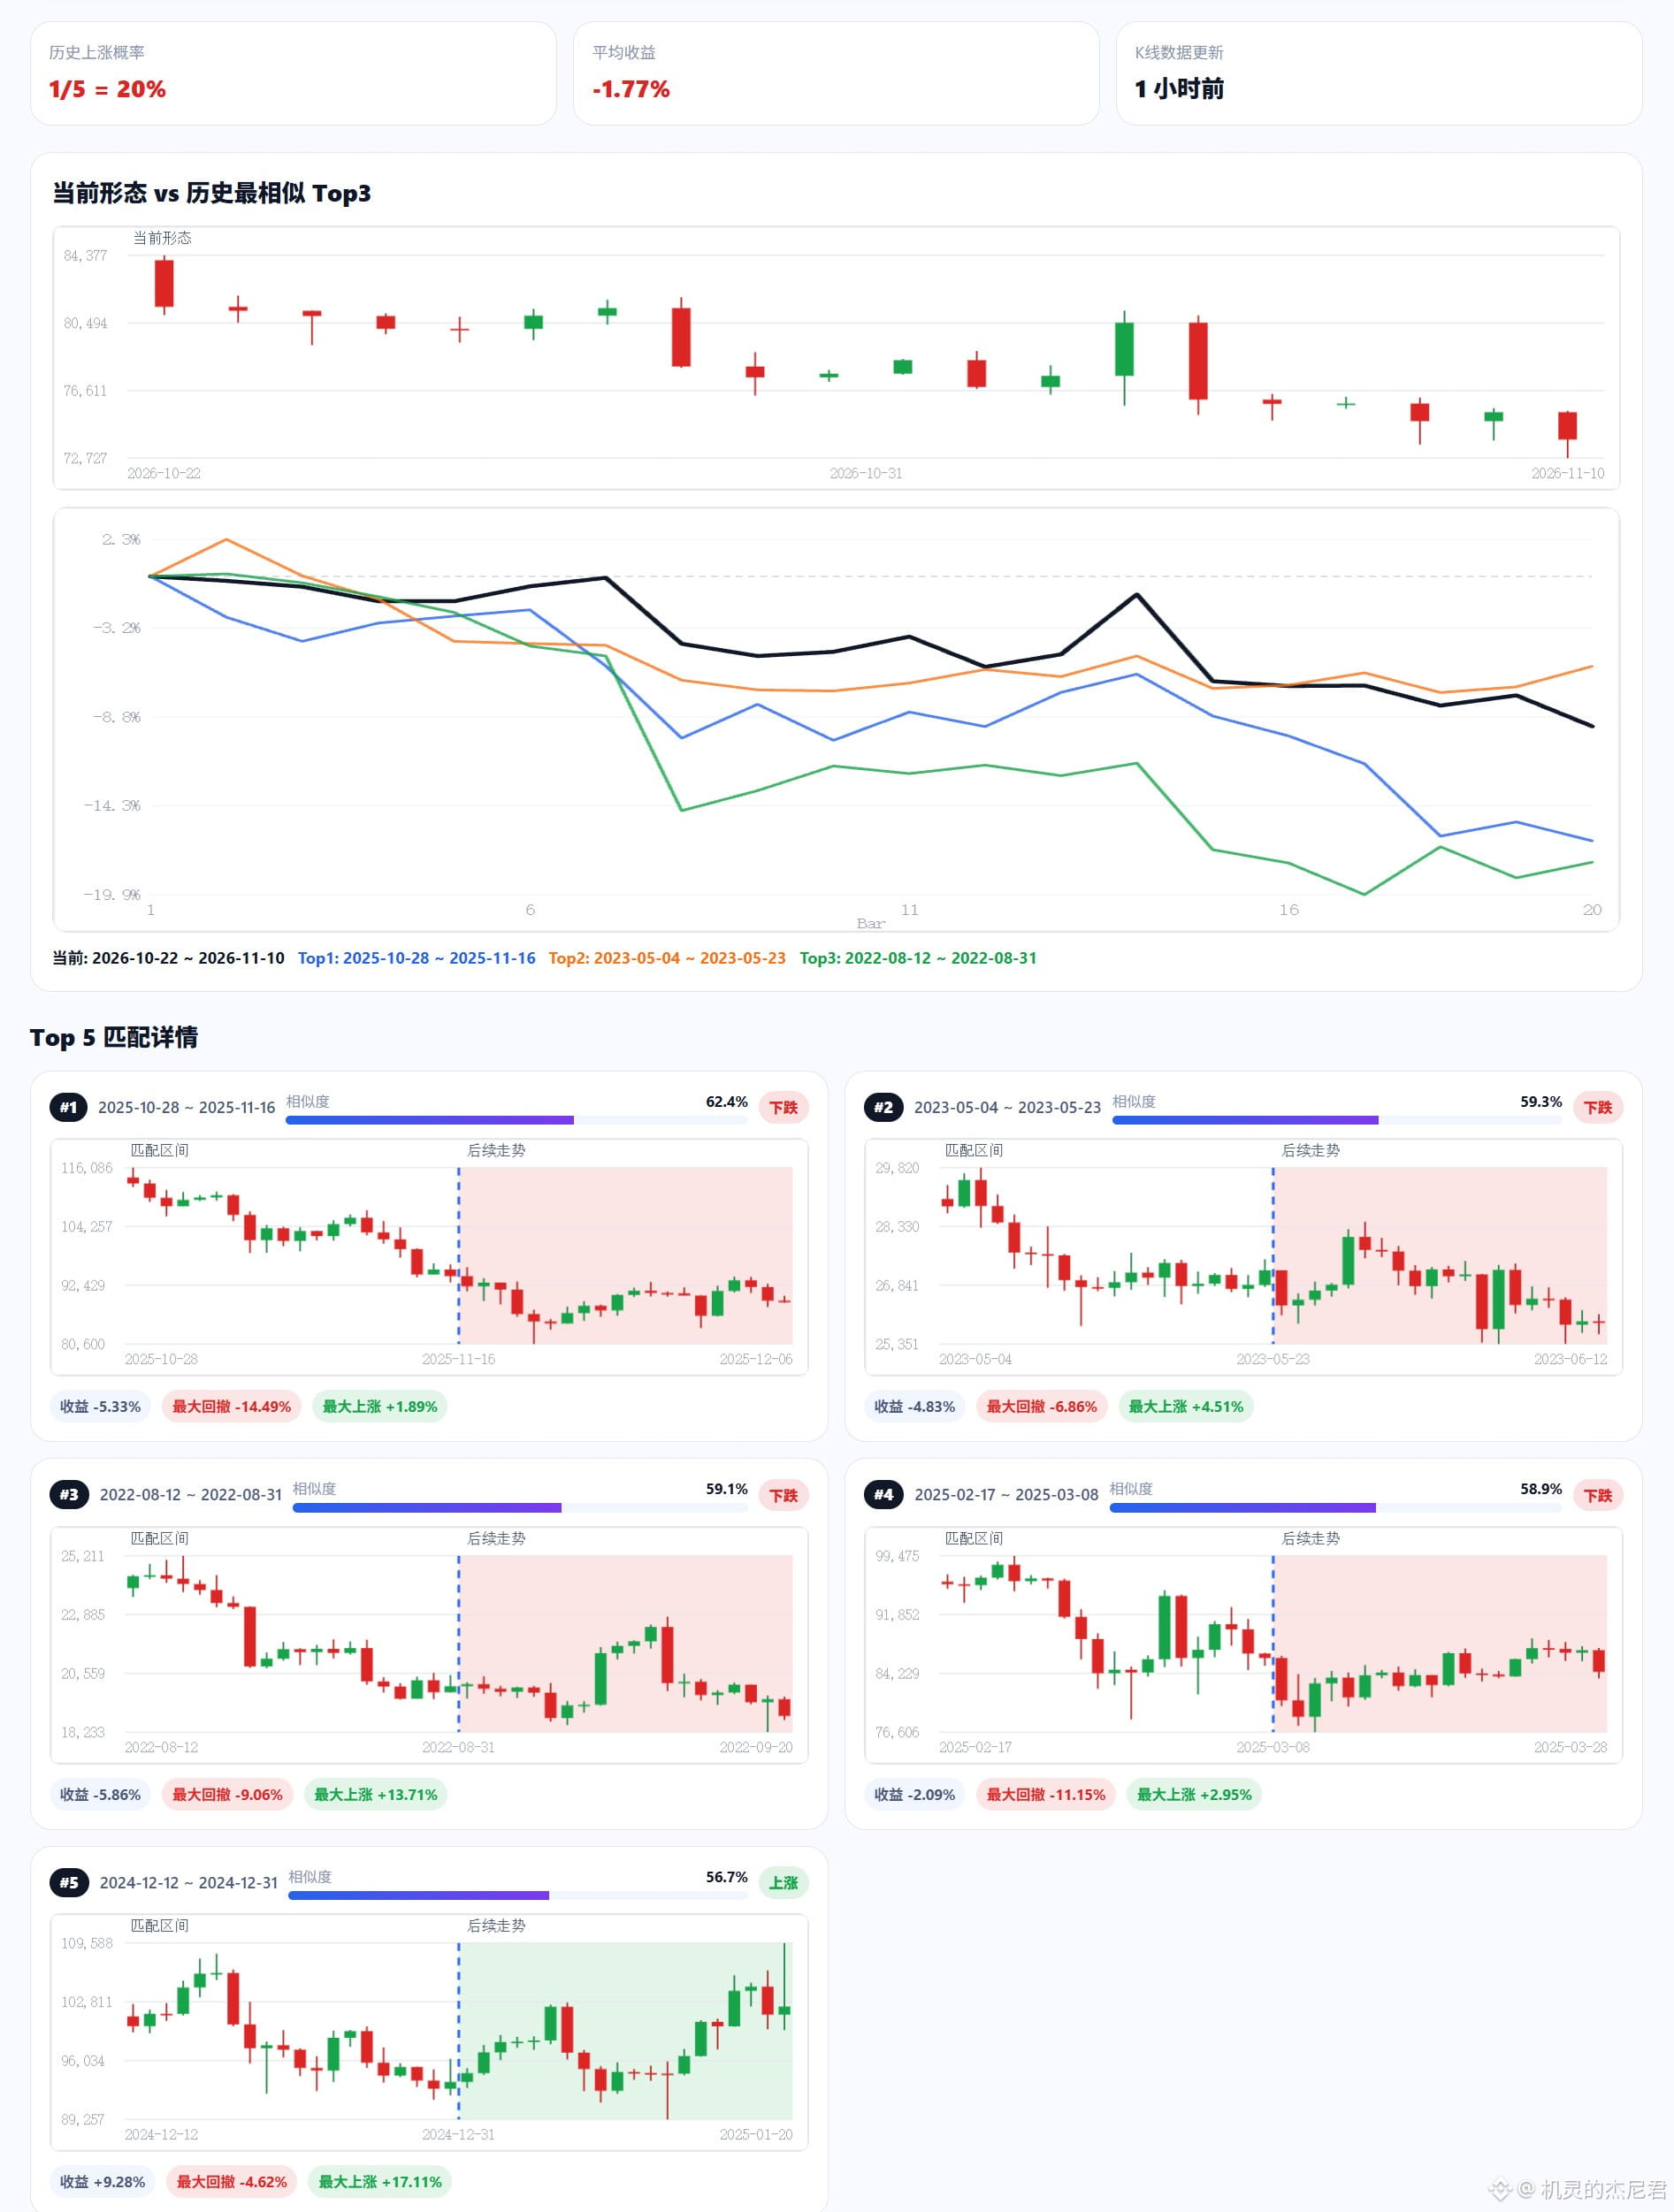
Try the candlestick pattern matching feature on JN.com. Using a fusion of multidimensional algorithms, it scans six years of BTC historical data in seconds to find the periods with the most similar price movements—and then tells you what happened next.
The current outlook isn’t encouraging: the probability of a rise over the next 20 days is just 20%…
🔗: JN188.AI
Have you seen this candlestick pattern before?
Try the candlestick pattern matching feature on JN.com. Using a fusion of multidimensional algorithms, it scans six years of BTC historical data in seconds to find the periods with the most similar price movements—and then tells you what happened next.
The current outlook isn’t encouraging: the probability of a rise over the next 20 days is just 20%…
🔗: JN188.AI