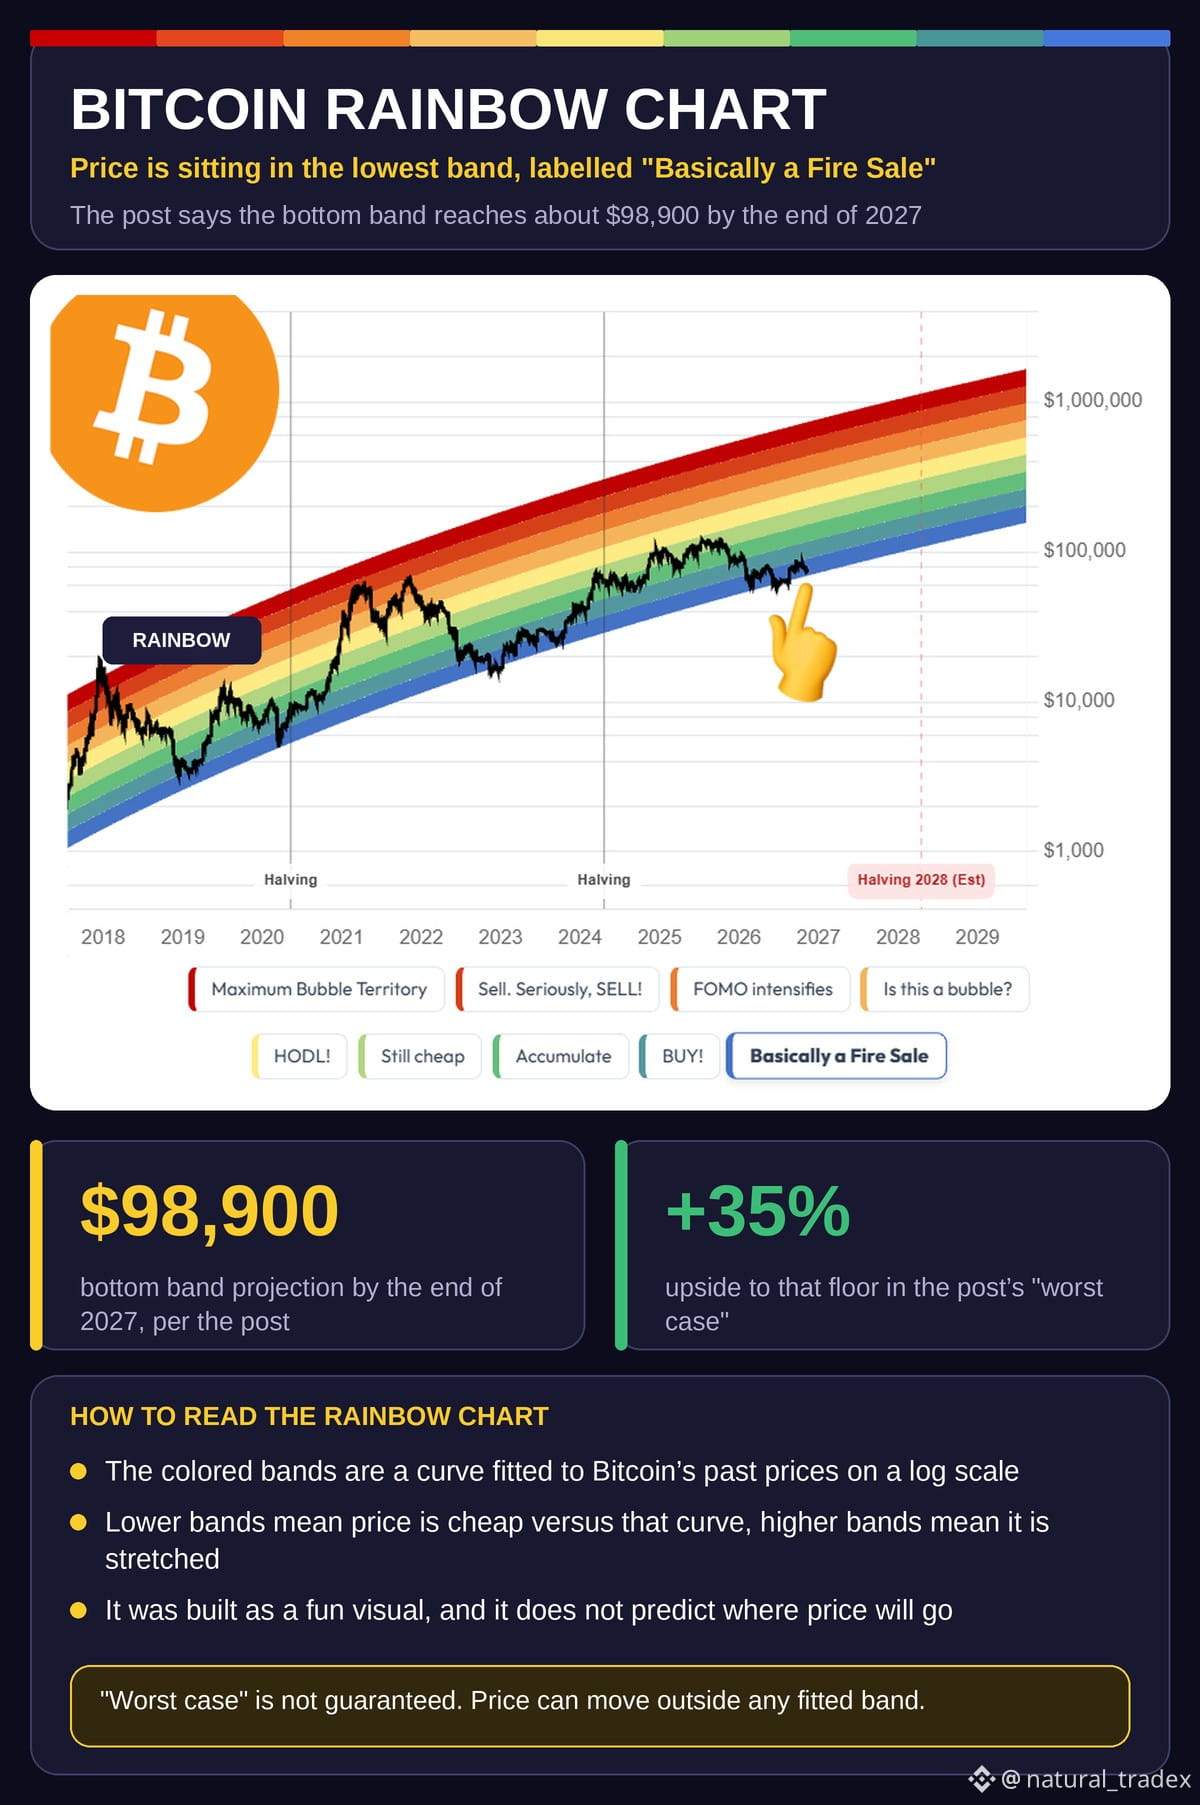
🔥 Fire sale? Bitcoin is in the lowest band of the Rainbow Chart 🌈
🔦 The popular Bitcoin Rainbow Chart places $BTC in its bottom blue band, labelled "Basically a Fire Sale". A viral post says that band is near $98,900 by the end of 2027, a gap of about 35% from the price it used 📊
🗺️ THE BAND LABELS, TOP TO BOTTOM
🔸 Maximum Bubble Territory
🔸 Sell. Seriously, SELL!
🔸 FOMO intensifies
🔸 Is this a bubble?
🔸 HODL!
🔸 Still cheap
🔸 Accumulate
🔸 BUY!
🔸 Basically a Fire Sale
🧠 HOW TO READ IT
The bands come from a logarithmic curve through past highs and lows. A low band means price is below its long-term trend, not that a rebound is certain 🔬
⚠️ REMEMBER
The chart was designed for fun, and it can be wrong. The "worst case" label is a story the chart tells, not a guarantee. Keep your risk limits and wait for confirmation before acting 🧘
🙋 Do you use the Rainbow Chart in your plan? Share below 👇
#CryptoTrading #SwingTrading #TechnicalAnalysis #Binance #BinanceSquare
🔦 The popular Bitcoin Rainbow Chart places $BTC in its bottom blue band, labelled "Basically a Fire Sale". A viral post says that band is near $98,900 by the end of 2027, a gap of about 35% from the price it used 📊
🗺️ THE BAND LABELS, TOP TO BOTTOM
🔸 Maximum Bubble Territory
🔸 Sell. Seriously, SELL!
🔸 FOMO intensifies
🔸 Is this a bubble?
🔸 HODL!
🔸 Still cheap
🔸 Accumulate
🔸 BUY!
🔸 Basically a Fire Sale
🧠 HOW TO READ IT
The bands come from a logarithmic curve through past highs and lows. A low band means price is below its long-term trend, not that a rebound is certain 🔬
⚠️ REMEMBER
The chart was designed for fun, and it can be wrong. The "worst case" label is a story the chart tells, not a guarantee. Keep your risk limits and wait for confirmation before acting 🧘
🙋 Do you use the Rainbow Chart in your plan? Share below 👇
#CryptoTrading #SwingTrading #TechnicalAnalysis #Binance #BinanceSquare