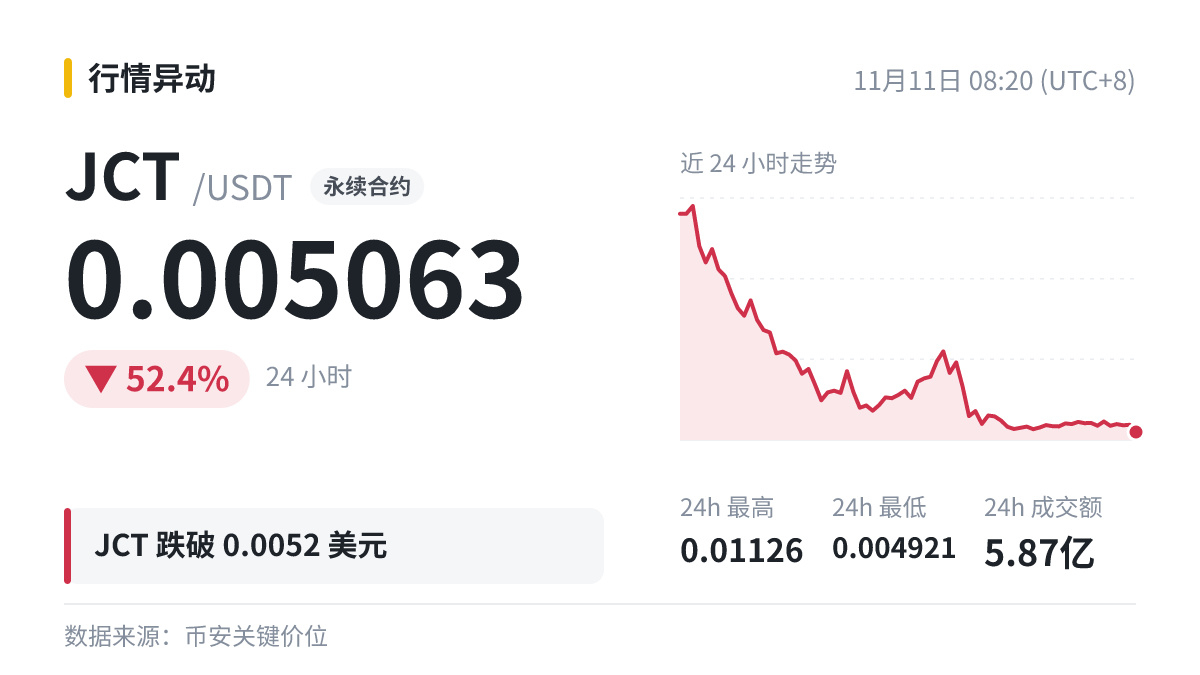
Indicator Notes | $JCT | Breaks below the 0.0052 level
First, a definition: A lot of stop-loss orders tend to cluster around key levels. If the price breaks through one, those stops may all be triggered, often causing volatility to spike.
Next, how to read it: Many people use key levels as a reference for managing their positions. Which side of the level they hold a position on, and where they place their stop-loss, is more practical than trying to guess the direction.
Indicators can be wrong, but risk management is essential: thinking ahead about what to do if you’re wrong matters more than getting the prediction right.
First, a definition: A lot of stop-loss orders tend to cluster around key levels. If the price breaks through one, those stops may all be triggered, often causing volatility to spike.
Next, how to read it: Many people use key levels as a reference for managing their positions. Which side of the level they hold a position on, and where they place their stop-loss, is more practical than trying to guess the direction.
Indicators can be wrong, but risk management is essential: thinking ahead about what to do if you’re wrong matters more than getting the prediction right.