$AKE 2. AKE
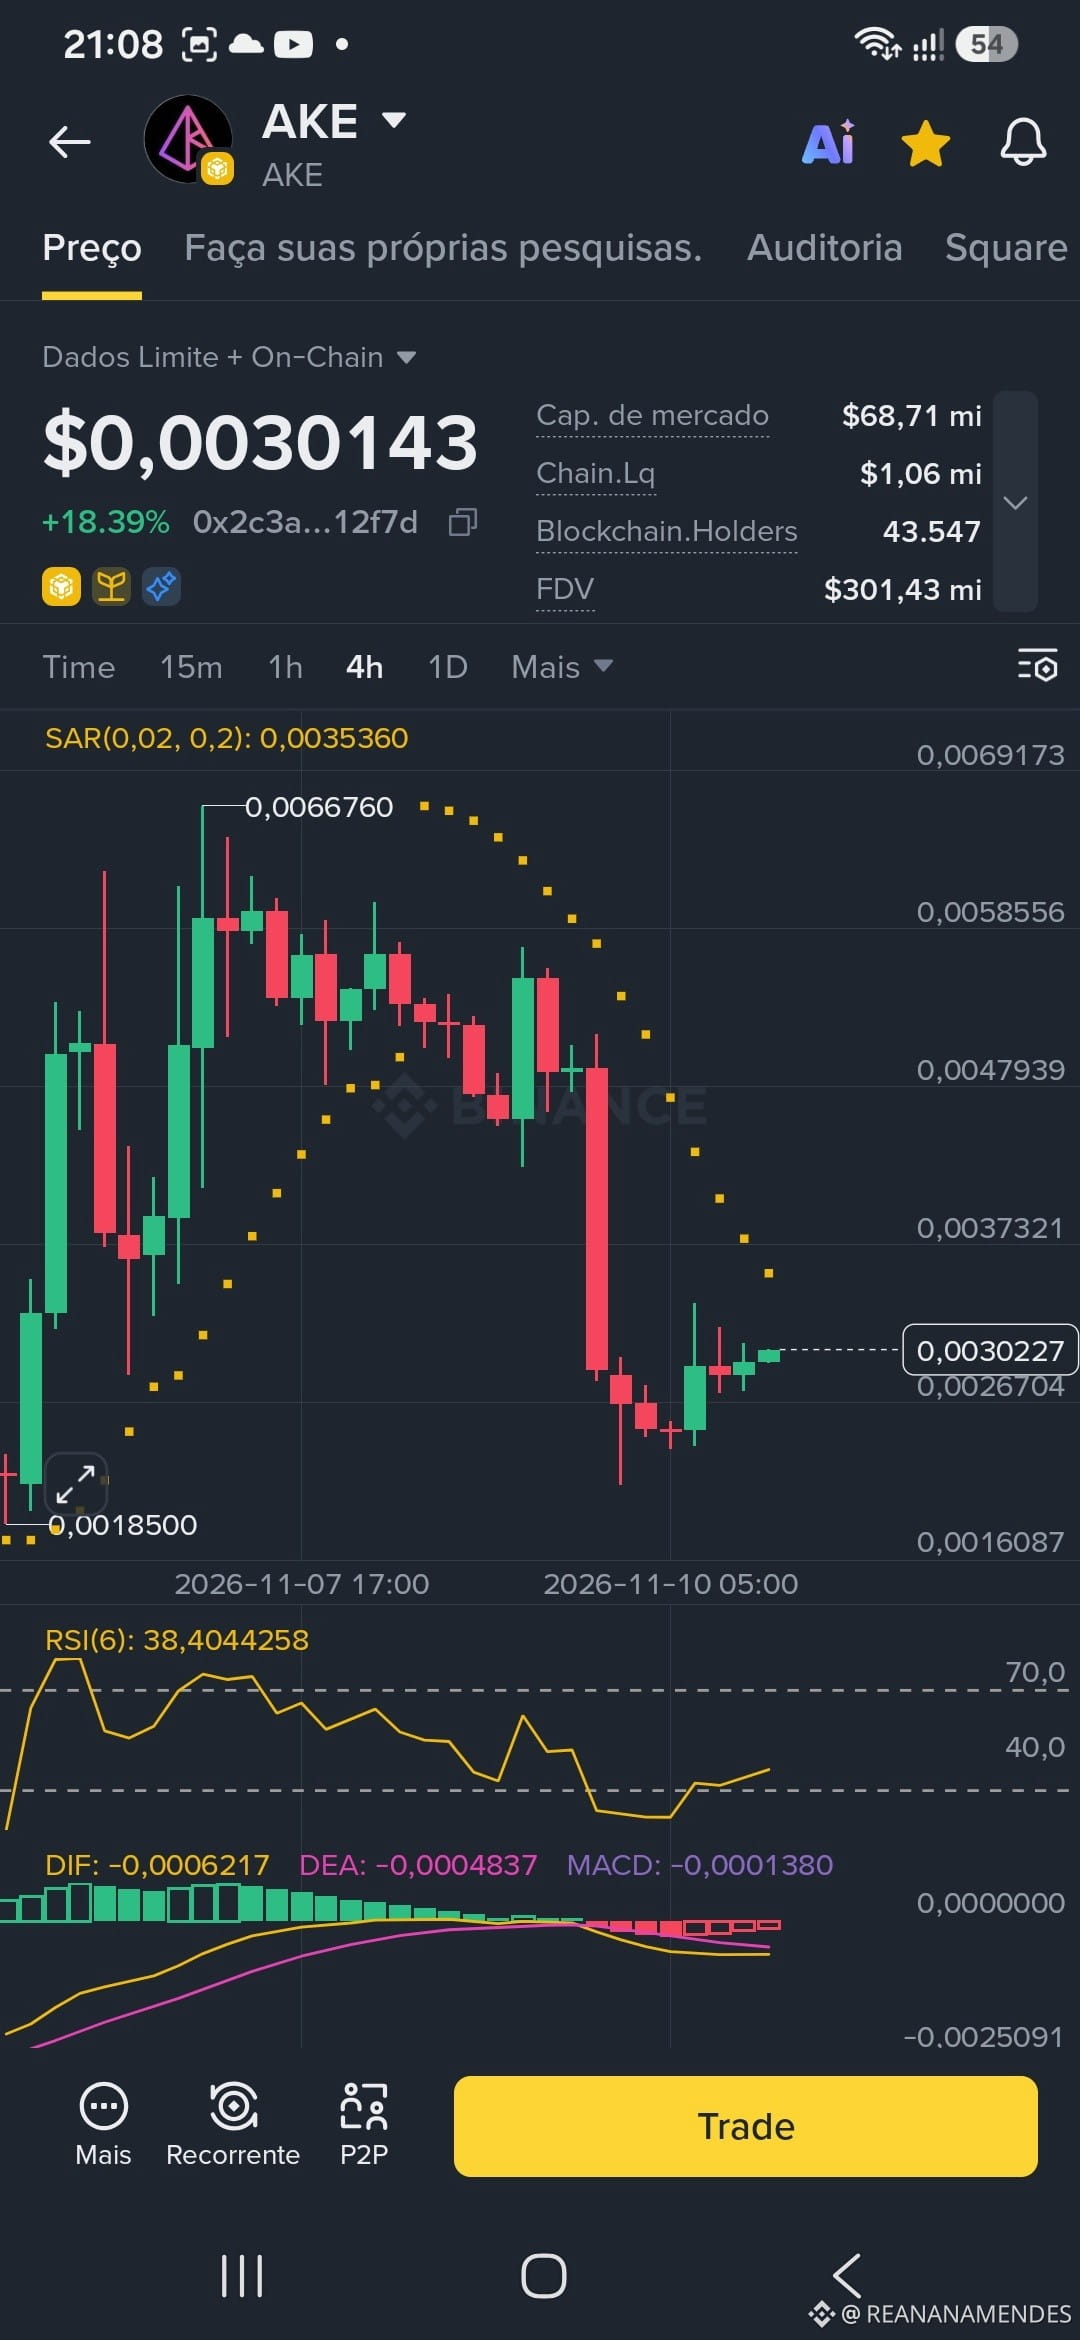
Overview: Interesting recovery movement. On the 4h chart, we see a strong rejection of previous lows, with the price seeking to stabilize around $0.030. On the 15m chart, the Parabolic SAR starts plotting below the candles, suggesting an attempt at a short-term trend reversal.
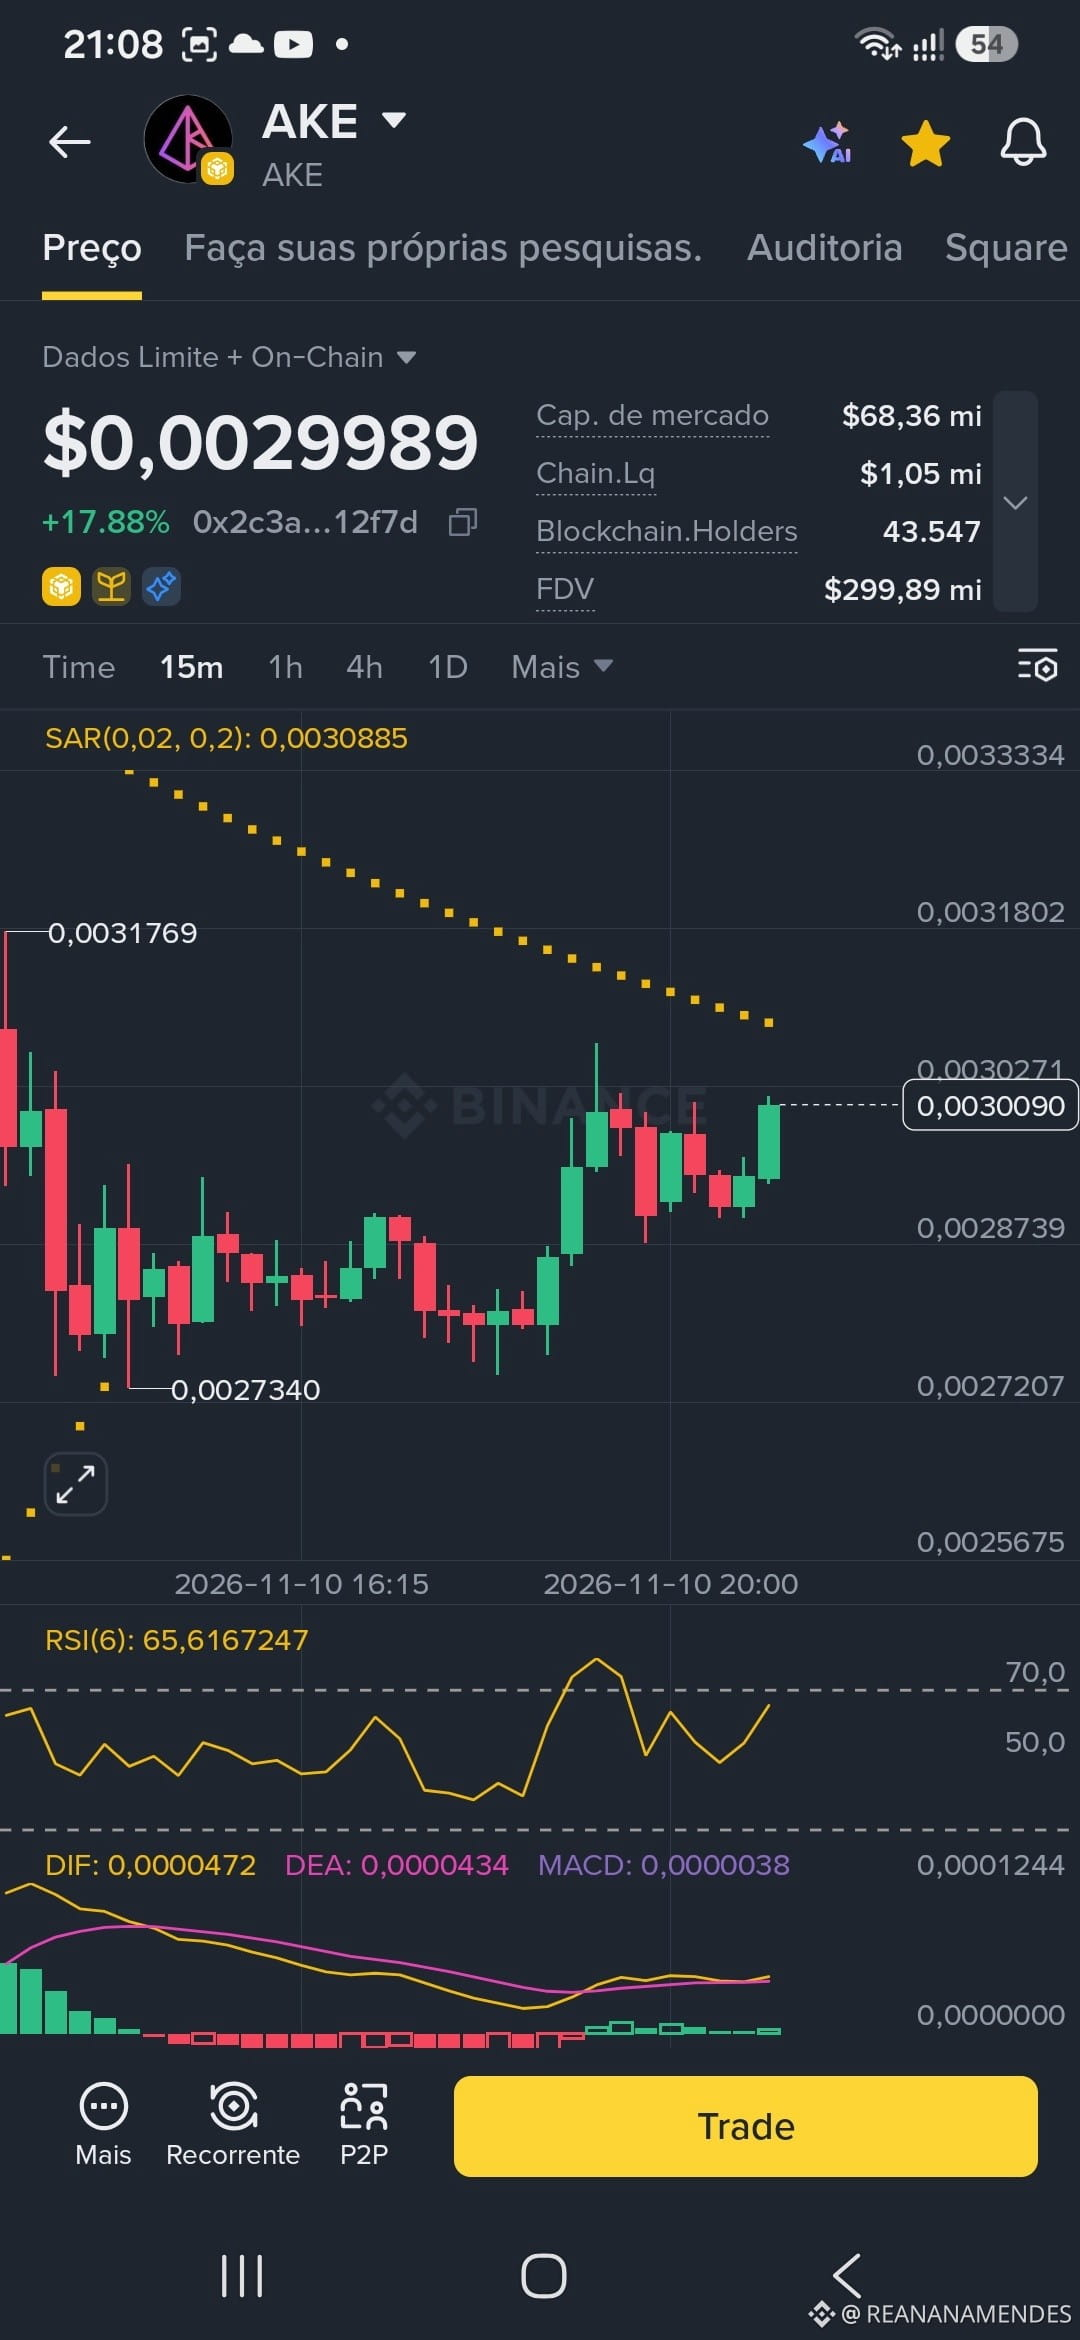
Keep an eye on: An RSI around 65 on the 15m chart leaves room to breathe, but it’s worth monitoring volume to confirm whether the breakout above local resistance holds.
Overview: Interesting recovery movement. On the 4h chart, we see a strong rejection of previous lows, with the price seeking to stabilize around $0.030. On the 15m chart, the Parabolic SAR starts plotting below the candles, suggesting an attempt at a short-term trend reversal.
Keep an eye on: An RSI around 65 on the 15m chart leaves room to breathe, but it’s worth monitoring volume to confirm whether the breakout above local resistance holds.